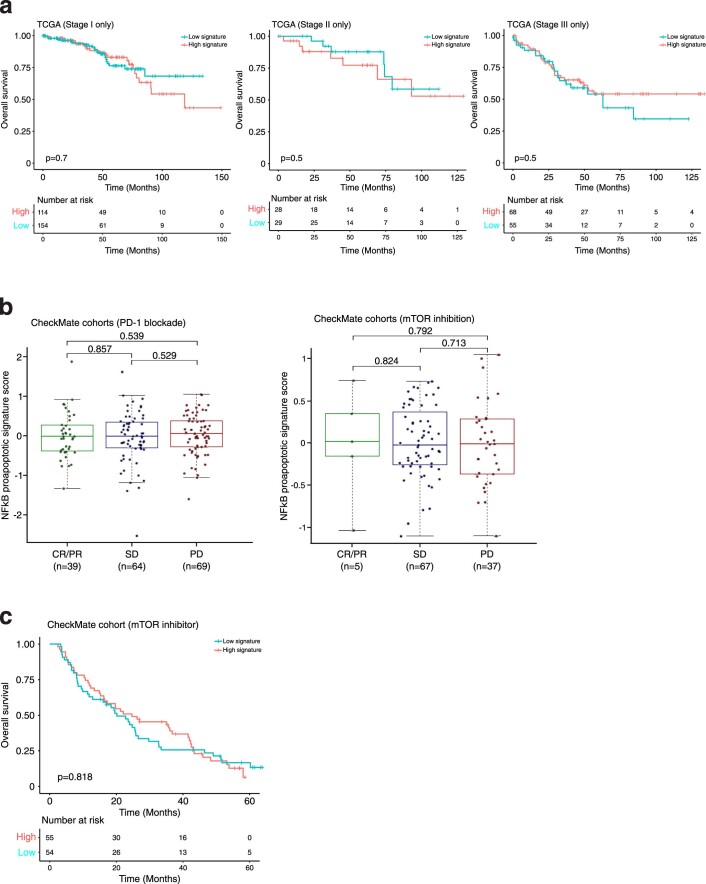
Extended Data Fig. 10. Single-cell chromatin derived signature and survival.
a, Overall survival for the indicated early stage (I, II, III) TCGA ccRCC cohorts based on high proapoptotic NFκB signature (≥median) versus low signature expression. Log-rank test was used to compare the survival between the two groups in each panel. TCGA stage I: Chisq=0.1 on 1 degrees of freedom, p = 0.7; TCGA stage II: Chisq=0.4 on 1 degrees of freedom, p = 0.5; TCGA stage III: Chisq=0.5 on 1 degrees of freedom, p = 0.5. b, NFκB-derived signature analysis of tumors from the CheckMate cohorts of advanced ccRCC examining response (two-sided Wilcoxon rank-sum test) following treatment with PD-1 blockade (left) or mTOR inhibition (right). For PD-1 blockade, CR/PR, n = 39 patients, SD n = 64 patients, PD n = 69 patients. For mTOR inhibition, CR/PR, n = 5 patients, SD n = 67 patients, PD n = 37 patients. Box plot statistical values including whiskers, quartiles, median, max and min values are listed in the Source Data file. c, Overall survival for the mTOR inhibition CheckMate cohort, based on high proapoptotic NFκB signature (≥median) versus low signature expression. Log-rank test was used to compare the survival between the two groups in each panel; Chisq=0.1 on 1 degrees of freedom, p = 0.818.

