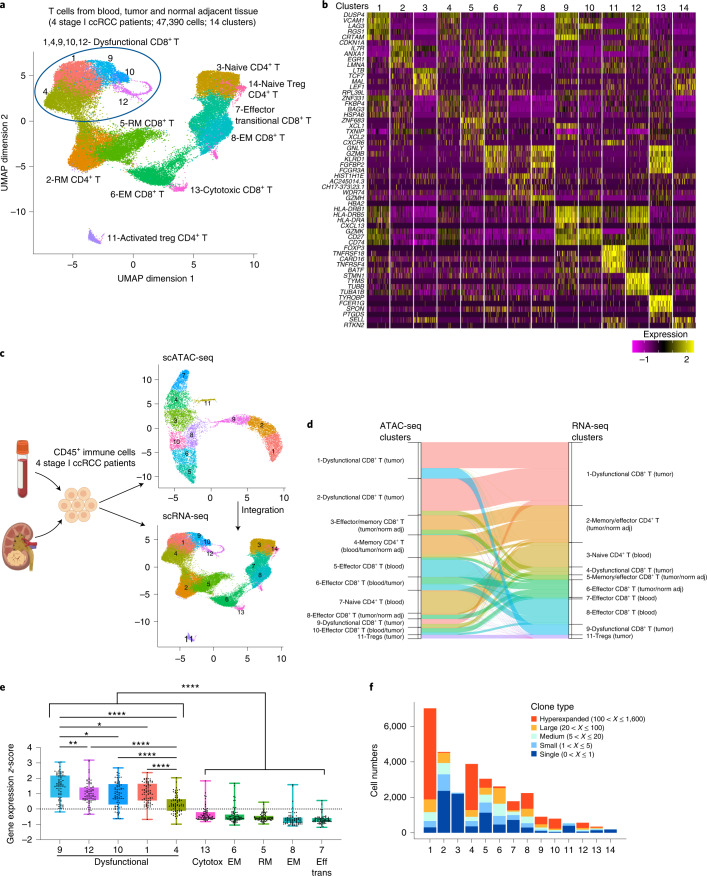
Fig. 3. Single-cell transcriptional profiling of T cells in ccRCC.
a, UMAP projection of 47,390 scRNA-seq profiles of T cells isolated from peripheral blood, tumor and adjacent normal tissue from four patients (a subset of the patients that were profiled epigenetically). Each dot corresponds to one single cell colored according to cell cluster. b, Heatmap of normalized expression of the top five marker genes in each cluster. c, Workflow for integrating scATAC-seq and scRNA-seq data from the same samples, divided into two. Left, experimental workflow. Image created with BioRender.com. Right, UMAP projection of scATAC-seq (top panel) and scRNA-seq (bottom panel) cells from four ccRCC patients for whom matched data from both modalities were available. d, Alluvial plot depicting annotation of cells in scATAC-seq data with cluster identities transferred from scRNA-seq data. The ribbon width corresponds to the number of cells in the specified scATAC-seq cluster (left side of the ribbon) that were annotated with the cluster identity of the corresponding scRNA-seq cluster (right side of the ribbon). To reduce clutter, only ribbons with width representing more than 20 cells are presented in this plot. For a complete overview, see Extended Data Fig. 6d. Color of ribbons corresponds to the color of the scRNA-seq clusters in the UMAP projection in c. e, Dysfunction gene expression levels in the indicated CD8+ T cell clusters (n = 4 patients; Methods). Each dot represents one of the 75 genes in the dysfunction gene module identified through gene module analysis; gene expression z-score distribution of these genes is depicted in boxplot format for each of the T cell clusters. One-way ANOVA test, Holm–Sidak correction for multiple comparisons. *P < 0.05, **P < 0.01, ****P < 0.0001. f, Plot showing counts of cells assigned into specific TCR clonal frequency ranges in each cluster as indicated in a.

