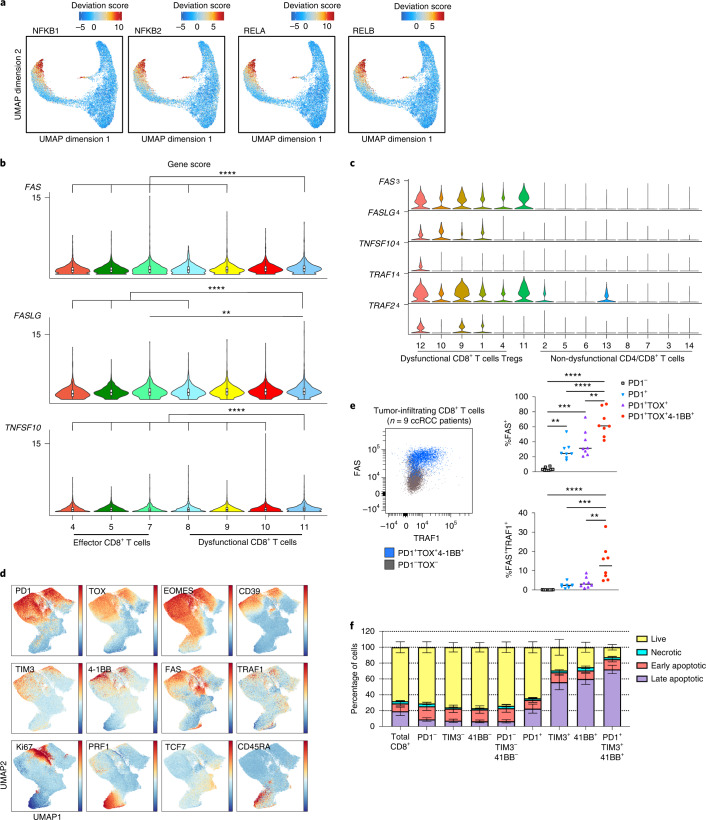
Fig. 4. NF-κB drives a pro-apoptotic program in late dysfunctional CD8+ T cells infiltrating ccRCC.
a, UMAP projection of scATAC-seq profiles colored by chromVAR TF motif bias-corrected deviations of the indicated TFs (NFKB1/2 and RELA/B were significantly enriched in C11_CD8 compared with the other CD8 T cell clusters; two-sided Wilcoxon rank-sum test P < 2.2 × 10⁻¹⁶, n = 18,736 cells). b, Violin plots of gene activity scores of the indicated NF-κB transcriptional targets for effector/nondysfunctional (C4,5,7_CD8) and dysfunctional (C8,9,10,11_CD8) T cell clusters. Pairwise comparisons of gene activity scores for the indicated gene between specified T cell clusters were determined using a two-sided Wilcoxon rank-sum test. The resulting P values underwent multi-test correction with the FDR method (**adjusted P < 0.01, ****adjusted-P < 0.0001; raw adjusted P values are listed in the source data; for clusters 4, 5, 7, 8, 9, 10, 11, n = 1,810, 1,821, 873, 924, 1,775, 2,440 and 1,613 cells, respectively). c, Violin plots showing gene expression levels of the indicated NF-κB transcriptional targets in CD4+ and CD8+ clusters, clustered as indicated in Fig. 3a (for clusters 1, 2, 3, 4, 5, 6, 7, 8, 9, 10, 11, 12, 13 and 14, n = 8,677, 7,423, 5,390, 5,272, 4,469, 4,160, 3,974, 3,689, 1,080, 890, 751, 669, 618 and 328 cells, respectively). d, Flow cytometry analysis of tumor-infiltrating CD8+ T cells. UMAP projection of expression of selected T cell markers in CD8+ T cells (n = 9 ccRCC patients). Color gradient indicates expression level (red, high; blue, low). e, Protein expression of NF-κB targets in tumor-infiltrating CD8+ T cells. FACS plot (FAS versus TRAF1) overlay of PD-1−TOX− (nondysfunctional) and PD-1+TOX+4-1BB+ (late dysfunctional) CD8+ T cell populations (left). Dot plots showing the percentages of FAS+ and FAS+TRAF1+ cells in different CD8+ T cell populations (right; one-way ANOVA test, Holm–Sidak correction for multiple comparisons; n = 9 ccRCC patients; **P < 0.01, ***P < 0.001, ****P < 0.0001; raw P values are listed in the source data). f, Apoptosis flow cytometry analysis. Bar graph showing the viability status (mean ± s.e.m.) as defined by flow cytometry for the indicated CD8+ T cell subsets (n = 10 ccRCC patients; raw P values are listed in the source data).

