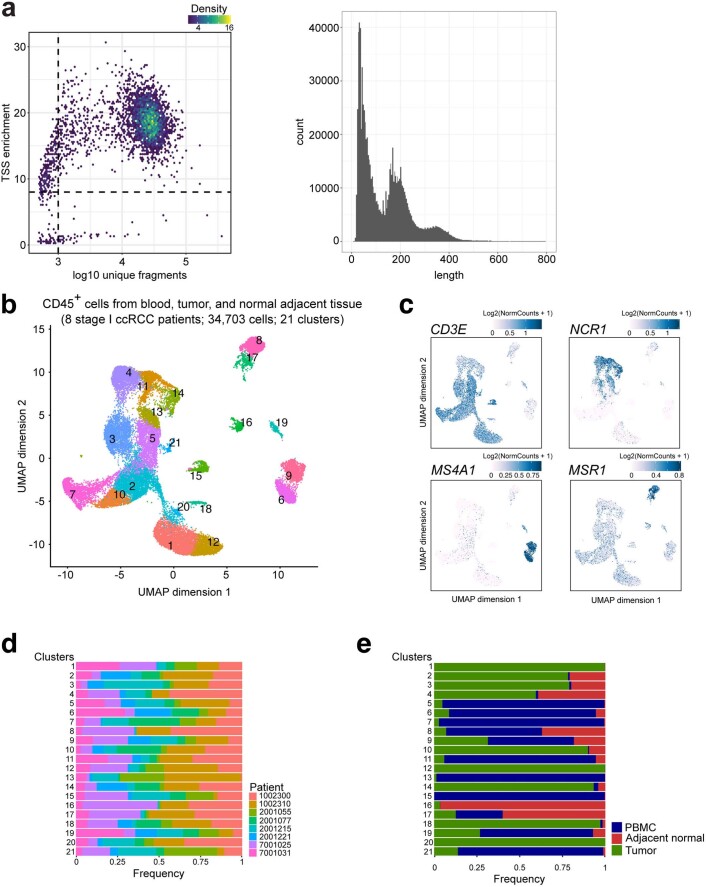
Extended Data Fig. 1. Single-cell chromatin accessibility of immune cells in ccRCC.
a, Representative scATAC-seq data quality control filters of a patient sample (patient 1002300, tumor; left). The x-axis shows the number of unique ATAC-seq nuclear fragments (in log scale) in each single cell (each dot) and the y-axis shows the transcriptional start sites (TSS) enrichment of all fragments in that cell. Dashed lines represent the filters for high-quality single-cell data (at least 1,000 unique fragments and TSS score great than or equal to 8). Representative plot of scATAC-seq fragment size distributions demonstrating sub-, mono-, and multi-nucleosome spanning ATAC-seq fragments (right). b, UMAP projection of 34,703 scATAC-seq profiles of CD45+ cells from peripheral blood, tumor, and adjacent normal tissue combining eight patient samples. Dots represent individual cells and colors indicate cluster identity. c, UMAP projection of immune cells colored by gene scores, reflecting the general chromatin accessibility of the indicated gene. d, Patient-specific contribution of cells in each cluster derived from b. e, Tissue-specific contribution of cells in each cluster derived from b.

