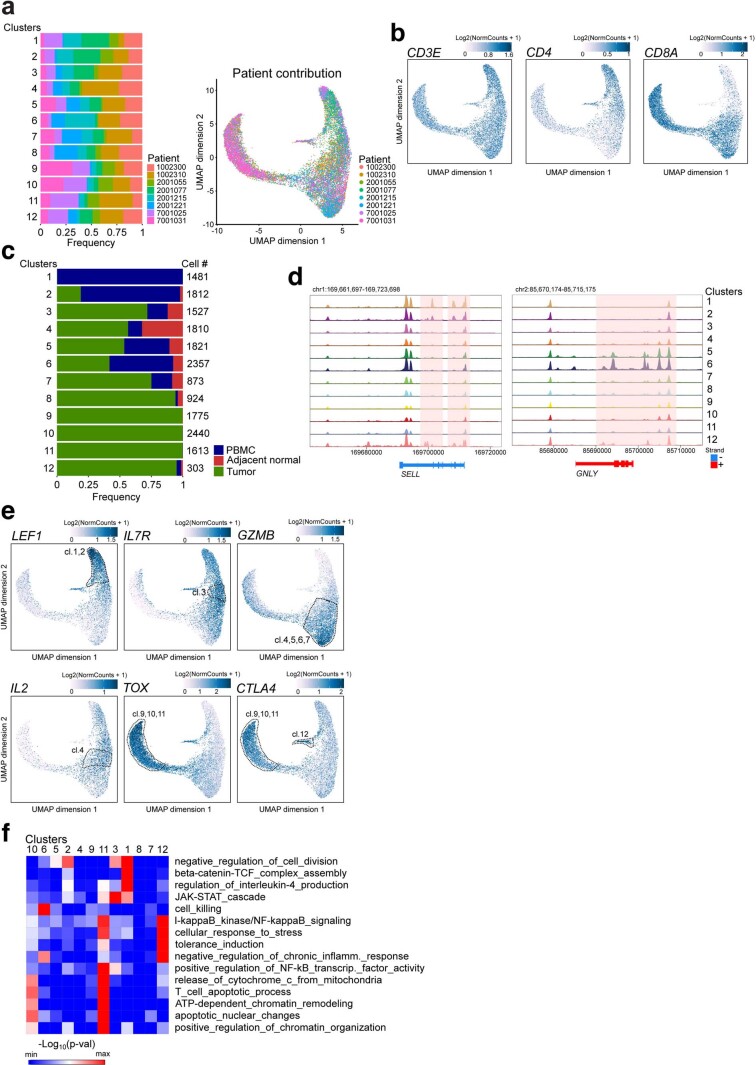
Extended Data Fig. 2. Cis-regulatory elements in open chromatin regions of T cells in ccRCC.
a, Patient-specific contribution of T cells in each cluster derived from Fig. 1b (left), and UMAP projection (right). b, UMAP projection of T cells colored by gene activity scores of the indicated gene (n = 18736 cells). c, Tissue-specific contribution of T cells in each cluster. d, Genome tracks of aggregate scATAC-seq data visualization of the SELL and GNLY loci, clustered as indicated in Fig. 1b. e, UMAP projection of T cells colored by gene activity scores of the indicated gene. f, Enrichment of Gene Ontology terms associated with the top accessible cis-regulatory elements of at least one cluster (LFC > 1.5, FDR < 0.01 compared to other clusters), across all clusters. Selected Gene Ontology terms that are significantly enriched (adjusted binomial p-value or adjusted hypergeometric p-value<0.05; here term enrichment was calculated using either the binomial test or the hypergeometric test, with p-values corrected with the Benjamini-Hochberg procedure) in at least one cluster are shown. Analysis was done using the software tool GREAT. Here, Benjamini-Hochberg corrected binomial p-values are shown.

