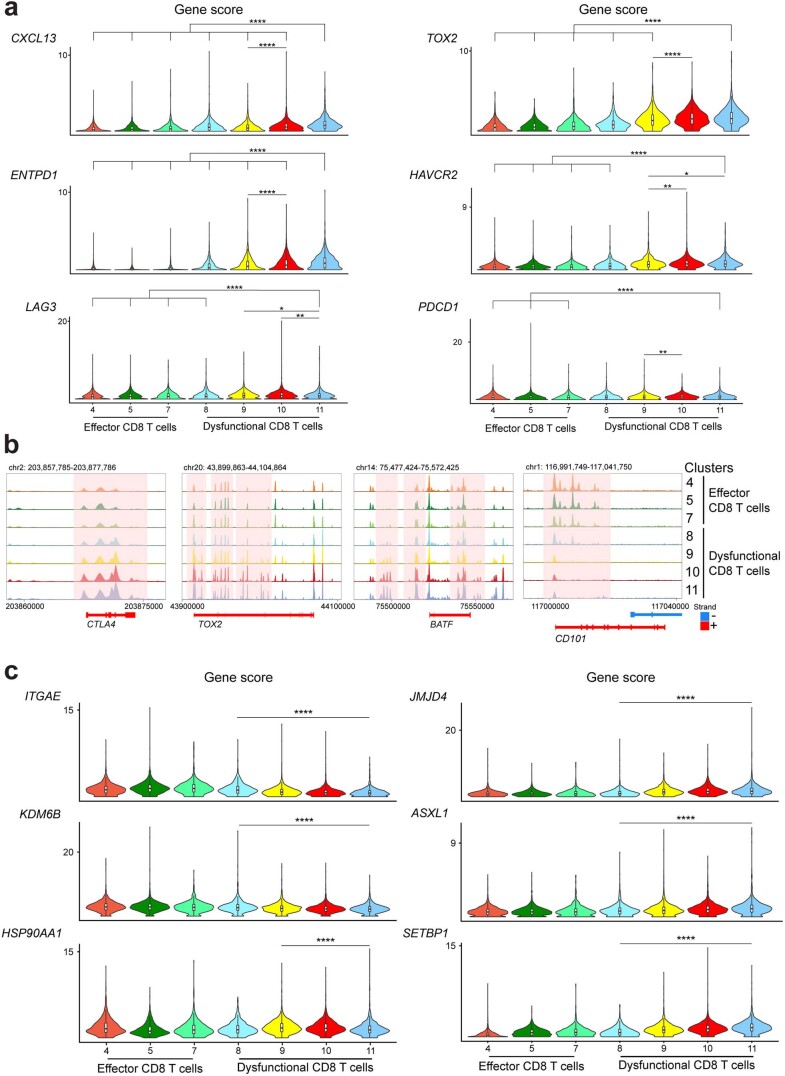
Extended Data Fig. 4. Regulatory chromatin landscapes of T cells in ccRCC.
a, Violin plots of gene activity scores of the indicated genes for effector/non-dysfunctional (C4,5,7_CD8) and dysfunctional (C8,9,10,11_CD8) T cell clusters. Pair-wise comparisons of gene activity scores for the indicated gene between specified T cell clusters were determined using a two-sided Wilcoxon rank-sum test. Resulted p values further underwent multi-test correction with the FDR method (*, adjusted-p < 0.05; **, adjusted-p < 0.01; ****, adjusted-p < 0.0001; raw adjusted p values are listed in the Source Data file). b, Genome tracks of aggregate scATAC-seq data visualization of the indicated gene locus, clustered as denoted in Fig. 1b. c, Violin plots of gene activity scores of the indicated genes for dysfunctional (C8,9,10,11_CD8) T cell clusters (two-sided Wilcoxon rank sum test; ****, p < 0.0001; raw adjusted p values are listed in the Source Data file). Comparisons based on Fig. 2c (early/middle versus late dysfunction fate). Effector/non-dysfunctional (C4,5,7_CD8) T cell clusters are included for comparison. a, c, for clusters 4, 5, 7, 8, 9, 10, 11, n = 1810, 1821, 873, 924, 1775, 2440, 1613 cells, respectively.

