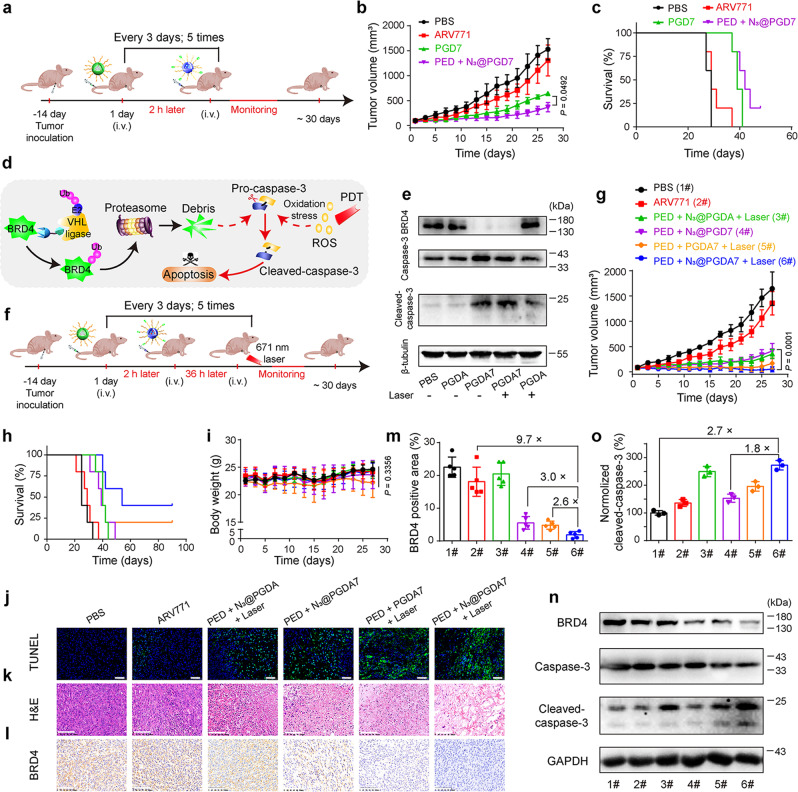
Fig. 6. Combining the bioorthogonal POLY-PROTAC NPs with PDT efficiently regressed breast tumour growth in vivo.
a Experimental schedule for the bioorthogonal POLY-PROTAC NP-based antitumor study. b Averaged tumour growth curves after treatment with various formulations (PBS, ARV771, PGD7 and PED + N3@PGD7; n = 5 biologically independent mice). Statistical analysis was performed by two-sided unpaired t-test. c Survival curves of the tumour-bearing mice (n = 5 biologically independent mice). d Schematic illustration of bioorthogonal POLY-PROTAC NP-based combinatorial therapy of breast tumours via BRD4 degradation and PDT-induced caspase-3 activation in the tumour cells. e The combination of ARV771 and PDT cumulatively activated caspase-3 in the tumour cells. Western blot assay of the tumour lysates after different treatments. f Experimental schedule of bioorthogonal POLY-PROTAC NP-performed combinatory therapy in an MDA-MB-231 xenograft tumour model. g Averaged tumour growth curves after treatment with various formulations (PBS, ARV771, PED + N3@PGDA + Laser, PED + N3@PGD7, PED + PGD7 + Laser, PED + N3@PGDA7 + Laser; n = 5 biologically independent mice; irradiation conditions: 400 mW/cm2, 5.0 min). Statistical analysis was performed by two-sided unpaired t-test. h Survival curves and i body weight changes of the tumour-bearing mice during the experimental period (n = 5 biologically independent mice). Statistical analysis was performed by one-way ANOVA with a Brown-Forsythe test. j TUNEL (blue: DAPI, green: apoptotic cells) and k H&E staining of the tumour sections 30-days post-treatment (scale bar = 100 μm). l IHC analysis and m Semiquantitative BRD4 expression in the tumour tissues (n = 5 biologically independent mice). n Western blot assay and o normalised expression of activated caspase-3 in the tumour lysates (n = 3 biologically independent mice) (1#: PBS; 2#: ARV771; 3#: PED + N3@PGDA + Laser; 4#: PED + N3@PGD7; 5#: PED + PGD7 + Laser; 6#: PED + N3@PGDA7 + Laser). All data are presented as mean ± SD.

