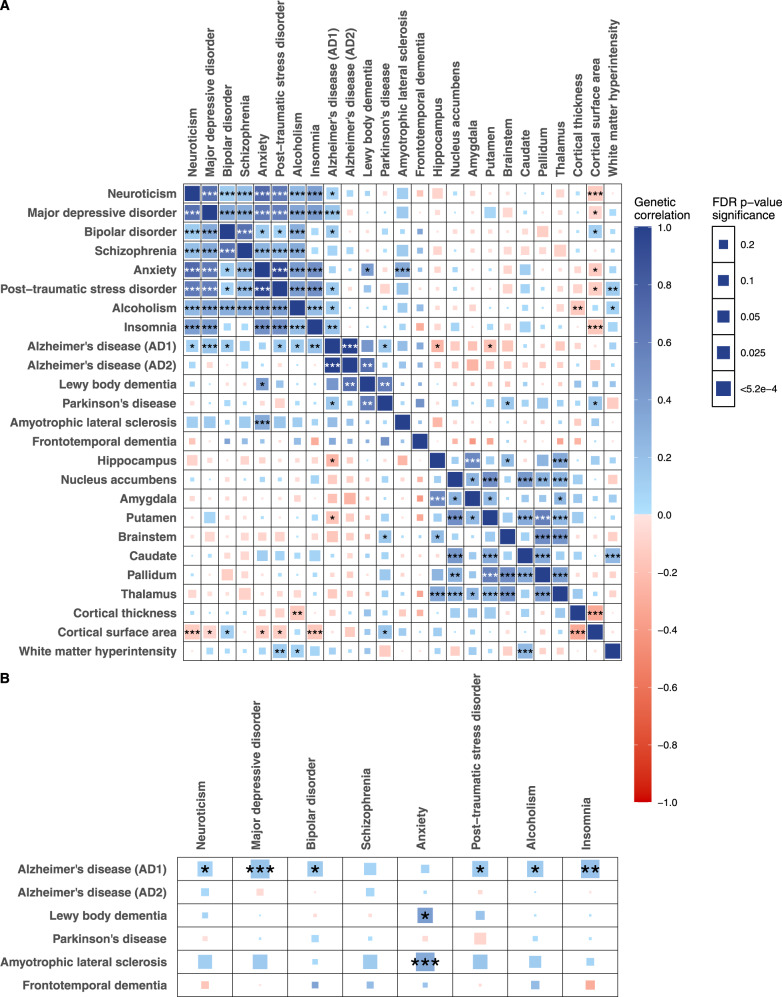
Fig. 2. Genetic correlations across brain structures, psychiatric, and neurodegenerative diseases.
A Pairwise genetic correlations among the 24 brain traits using LD score regression. B Genetic correlations between the psychiatric and neurodegenerative traits based on LD score regression. The color denotes the magnitude and direction of correlation. The size of the colored square reflects the magnitude of the p value. The asterisk indicates FDR p value: * FDR p < 0.05; ** FDR p < 0.01, *** FDR p < 0.001. The exact p values are provided in Table S2.

