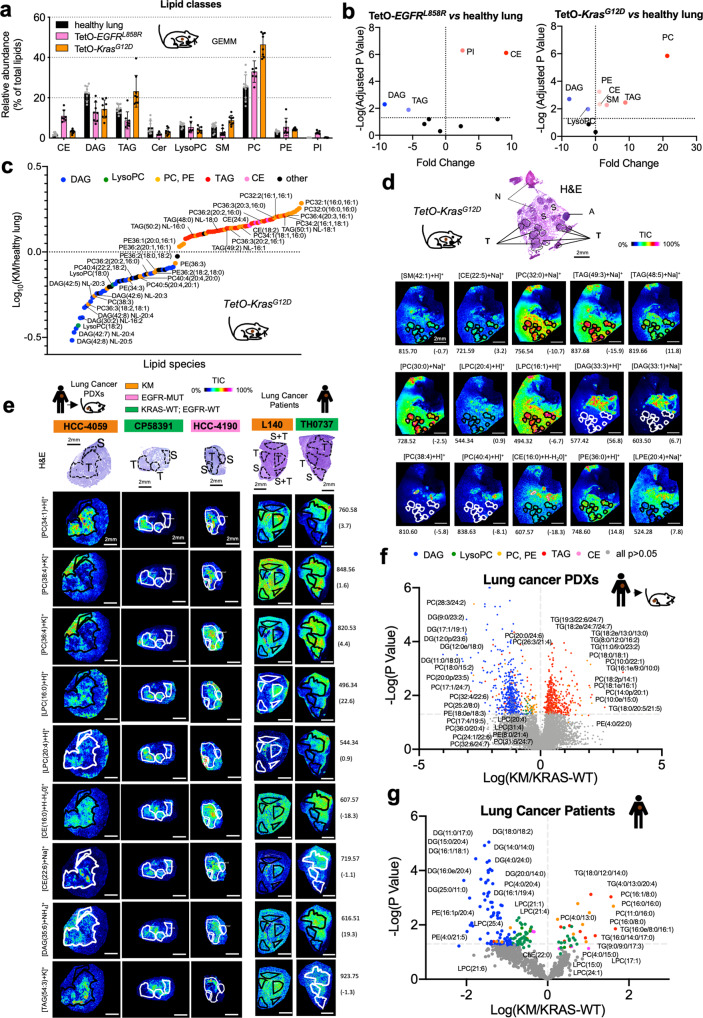
Fig. 1. KMLC has a unique lipidome.
a, b MS/MS Lipidomic analysis of murine TetO-KrasG12D tumors (n = 4), TetO-EGFRL858R (n = 3) and unaffected healthy lung (n = 3). Each dot indicates a lung/tumor section. Data are expressed as mean ± SD. PC, phosphatidylcholines; TAG, triglycerides; PE, phosphatidylethanolamines; CE, cholesteryl-esters; PI, phosphatidylinositols; DAG, diacylglycerides; SM, sphingomyelins; Cer, ceramides; LysoPC, lysophosphatidylcholines. Volcano plots in b show the lipid classes that are differentially represented for each comparison. The adjusted p-value and difference were calculated using multiple two-tailed t-tests with alpha = 0.05 followed by Benjamini, Krieger and Yekutieli FDR. c MS/MS and d MALDI imaging analyses showing lipid differentially represented in TetO-KrasG12D tumors as compared to unaffected heathy lung. e Representative pictures of MALDI imaging analysis of lung cancer patient-derived xenografts (PDXs) and primary human lung cancer specimens of the indicated genotype. In d and e rainbow scale represents % ion intensity normalized against the total ion count (TIC). Corresponding H&E and histological annotation are shown. T, tumor; S, stroma; S + T, stroma and tumor mix; N, necrotic area; A, artifact. In (d) and (e) observed m/z and mass error (ppm) values are indicated for each lipid species. Refer to Supplementary Data 1–4 for the complete tentative MALDI lipid annotation and relative quantification. f, g HPLC-MS/MS analysis of lung cancer PDXs and primary human lung cancer specimens of the indicated genotype. Volcano plots show lipid species identified by HPLC-MS/MS differentially represented in KM versus KRAS-WT samples (PDXs, KM n = 5 and KRAS-WT n = 4; lung cancer patients, n = 3/group). p-values were calculated using multiple two-tailed t-tests followed by Benjamini, Krieger, and Yekutieli FDR.

