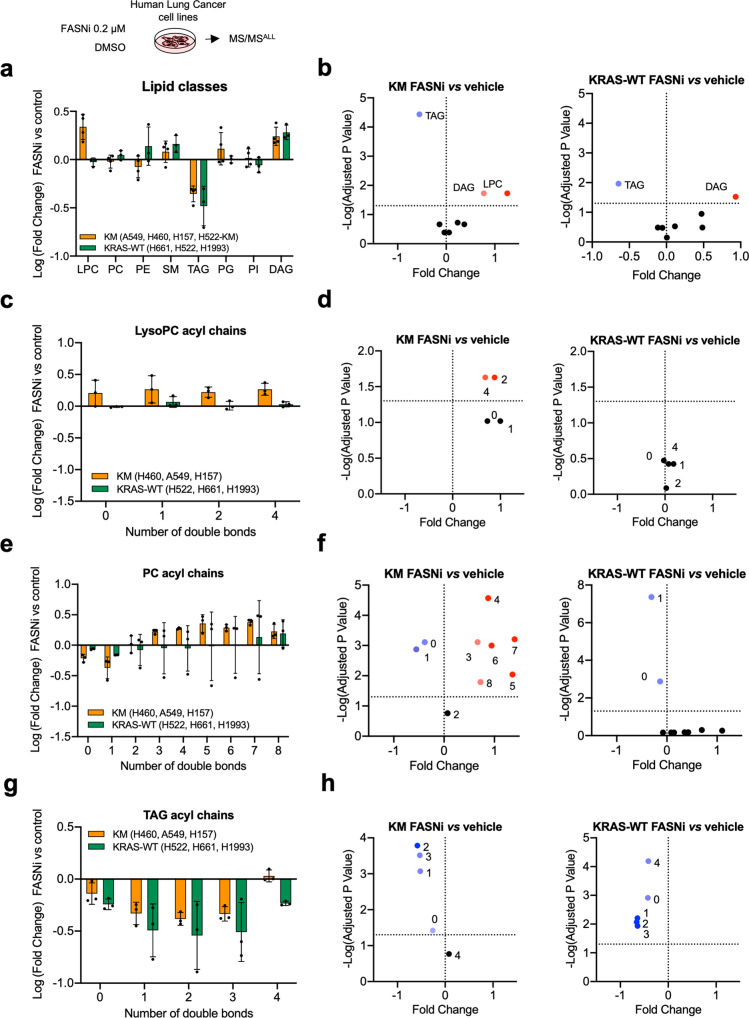
Fig. 4. FASNi induces accumulation of PUFA-PC and PUFA-LysoPC in KMLC.
a Variation of the lipid classes identified by MS/MS in KM and KRAS-WT LC cells. Bars represent Log (fold-change) of FASNi treatment over vehicle control (n = 3 biologically independent cell lines/group). b Volcano plots of multiple two-tailed t-tests followed by Benjamini, Krieger, and Yekutieli FDR representing the significant changes in lipid classes for the indicated comparisons (cutoff adj p < 0.05). c–h Relative double bond quantification in the indicated lipid classes (n = 3 biologically independent cell lines/group) and volcano plots showing the correspondent multiple two-tailed t-tests followed by Benjamini, Krieger, and Yekutieli FDR (cutoff adj p < 0.05). Bars express mean ± SD.

