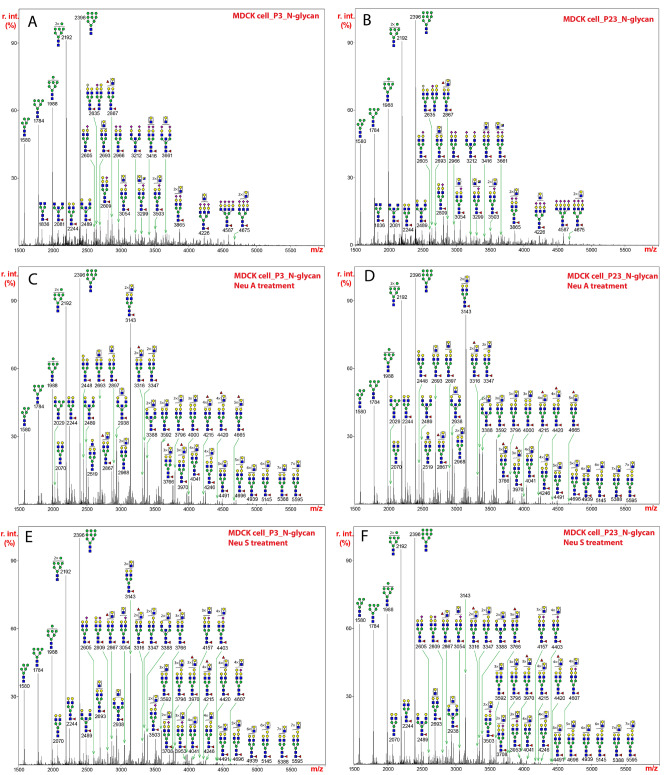
Figure 1.
N-glycans released from extracts of MDCK cells by treatment with PNGase F, permethylated, and analyzed by MALDI-TOF MS. The medial molecular range between m/z 1500 and 5500 is shown. Putative structures based on compositions and corresponding to masses detected are represented next to the corresponding mass peaks. (A) N-glycans from MDCK cells at passage 3, and (B) N-glycans from MDCK cells at passage 23. (C) N-glycans in (A) from extracts of MDCK cells at passage 3 were treated with neuraminidase A and analyzed. (D) N-glycans in (B) from extracts of MDCK cells at passage 23 were treated with neuraminidase A and analyzed. (E) N-glycans in (A) from extracts of MDCK cells at passage 3 were treated with neuraminidase S and analyzed. (F) N-glycans in (B) from extracts of MDCK cells at passage 23 were treated with neuraminidase S and analyzed. The assignments of N-glycan mass and compositions, as well as relative percentage abundance of each glycan species in (A), (C), and (E) are presented in Supplementary Table 3.

