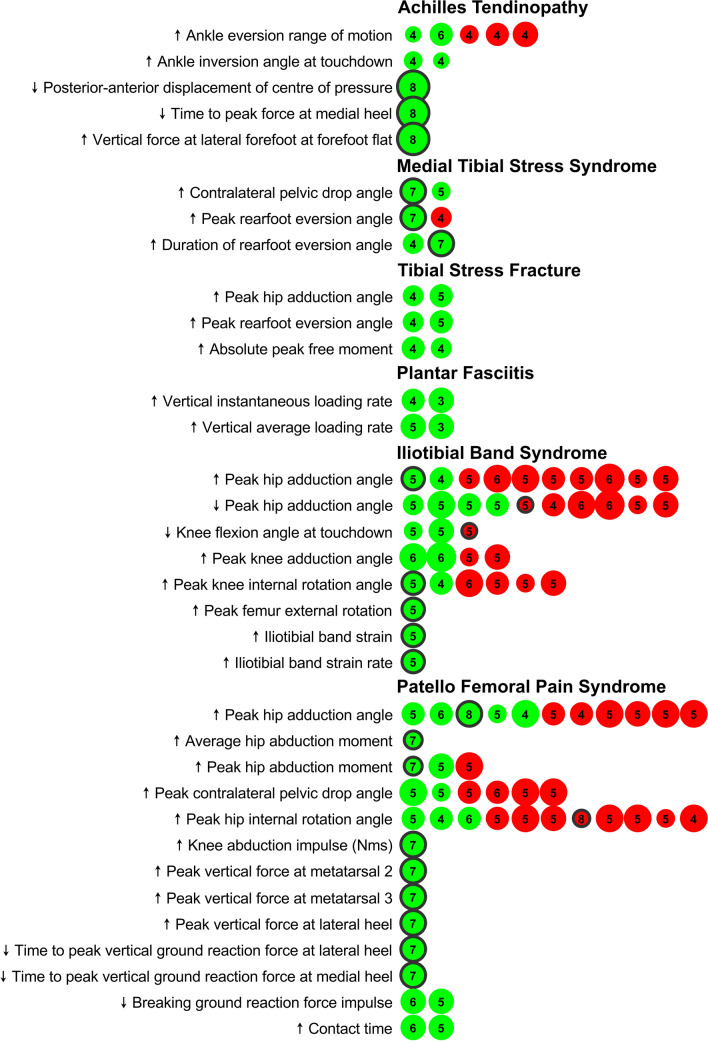
Fig. 2.
Graphic representation of the evidence associated with running-related risk factors that have passed our predefined relevance criterion (at least a significant difference in one prospective study or two retrospective studies). Dot size scales with Downs & Black quality rating of the studies (i.e., the bigger a dot, the higher the quality rating of the study). The number in the dots is the risk of bias score of the study. The green color represents a study that had found a significant difference between a group of injured runners compared to control. Red colors represent a study that could not find a significant difference between groups. Black circles around dots indicate a prospective study design (no circles = retrospective study design)

