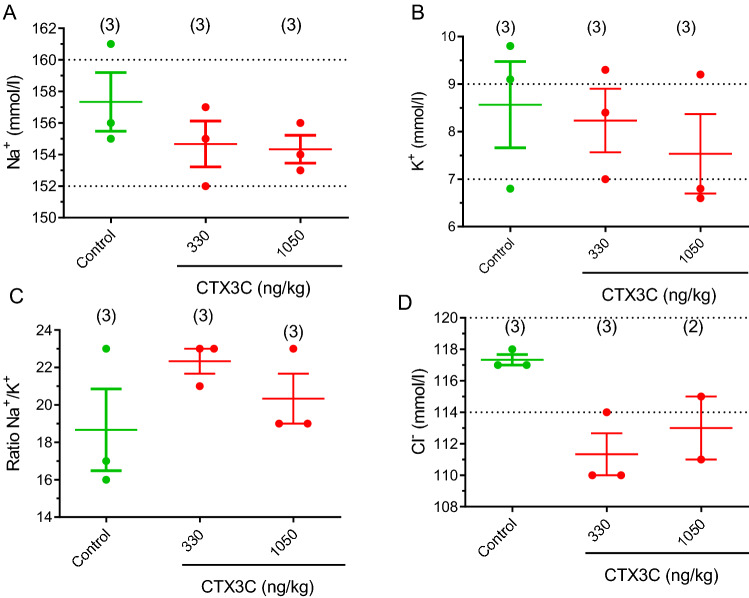
Fig. 6.
Scatter plot representation of the blood levels of sodium (A), potassium (B), ratio sodium/potassium (C) and chloride (D) in control Swiss female mice and in mice dosed by gavage with CTX3C at 330 and 1050 ng/kg bw after an observation period of 96 h. Data are expressed as means ± SEM The dotted line indicates the maximum and minimum physiological reference value for each parameter. Values are expressed as mean ± SEM from three determinations except for determination of Cl− in animals treated with 1050 ng/kg of CTX3C since the size of the sample was not enough in one of the treated animals

