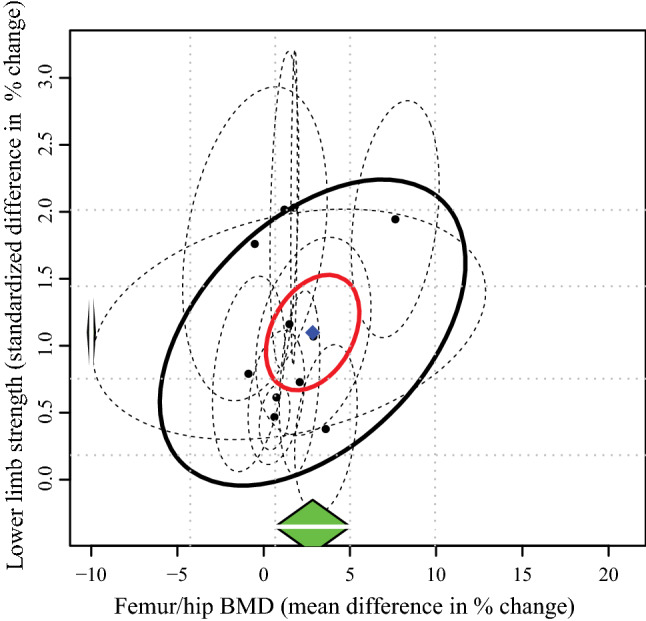
Fig. 2.

Correlation between changes in lower-limb muscle strength and femur/bone mineral density (BMD) for each individual study (black dots) and their 95% confidence intervals (dashed ellipses). The green diamonds show the estimated pooled change for each outcome separately, while the blue diamond shows the overall combined effect of the two outcomes. The red ellipse represents the 95% confidence interval of the combined effect, whereas the black ellipse represents the prediction interval for future studies
