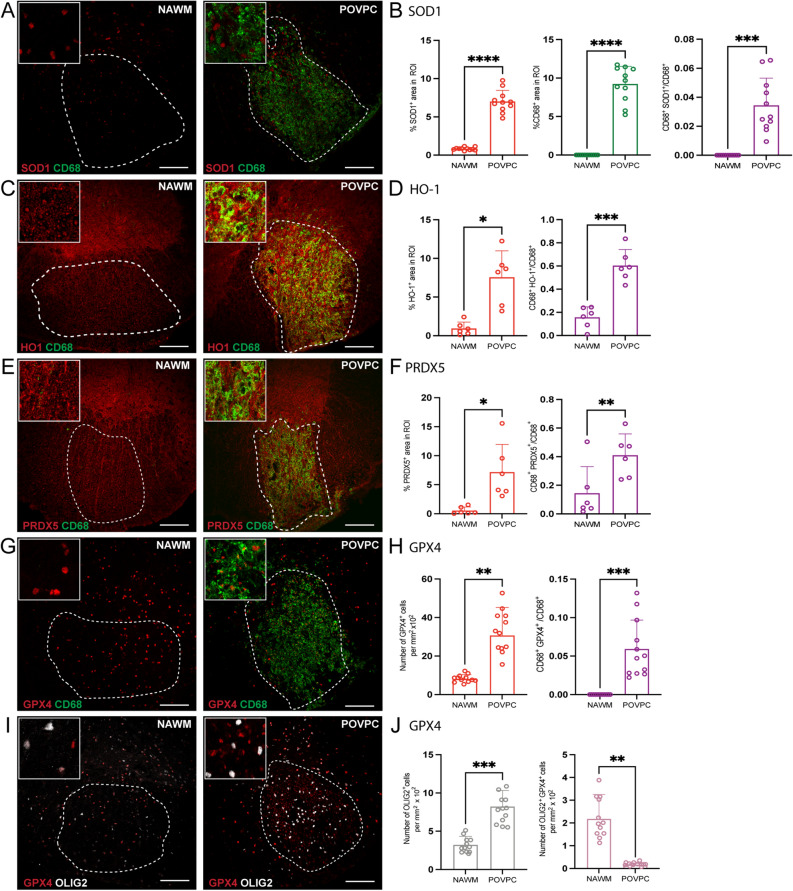
Figure 2.
Expression of antioxidant enzymes is upregulated in POVPC-induced spinal cord lesions. (A, C, E, G, I) Representative confocal images of NAWM or POVPC injected spinal cord labeled with CD68 for microglia/macrophage (green), antioxidant enzyme of interest (red), and OLIG2 for oligodendrocyte lineage cells (white). Dotted line indicates the NAWM or lesion region of interest (ROI) selected for image analysis. (B, D, F) Bar graphs comparing the percent of ROI that is CD68+, antioxidant enzyme of interest, and CD68+ antioxidant enzyme+. (H) Bar graph comparing the number of GPX4+ cells per mm2 × 102 of ROI and percent of ROI that is CD68+ GPX4+ (J) Bar graph representing number of OLIG2 + cells per mm2 × 102 of ROI and percent of ROI that is OLIG2+ GPX4+. Scale bar = 100 µm. Data are shown as mean ± S.D, n = 6–12 mice. Significance indicated as *p < 0.05, **p < 0.01, ***p < 0.001, ****p < 0.0001, two-tailed, paired student’s t-test.

