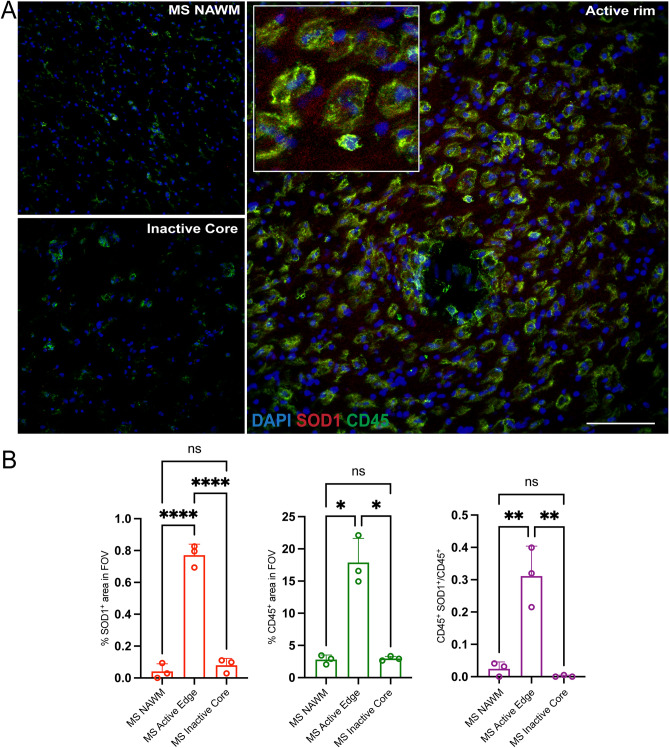
Figure 6.
Expression of SOD1 antioxidant enzyme is elevated in the chronic active rim of MS lesions. (A) Representative confocal images of NAWM, inactive Core, and active rim of an MS lesion labeled with CD45 for immune cells (green), SOD1 (red) and DAPI (blue). (B) Bar graphs comparing the percent of field of view (FOV) that is CD45+, SOD1+, and CD45+SOD1+. Scale bar = 100 µm. Data are shown as mean ± S.D, n = 3 MS patients. Significance indicated as *p < 0.05, **p < 0.01, ***p < 0.001, ****p < 0.0001, One-way ANOVA with Tukey's post-hoc test.

