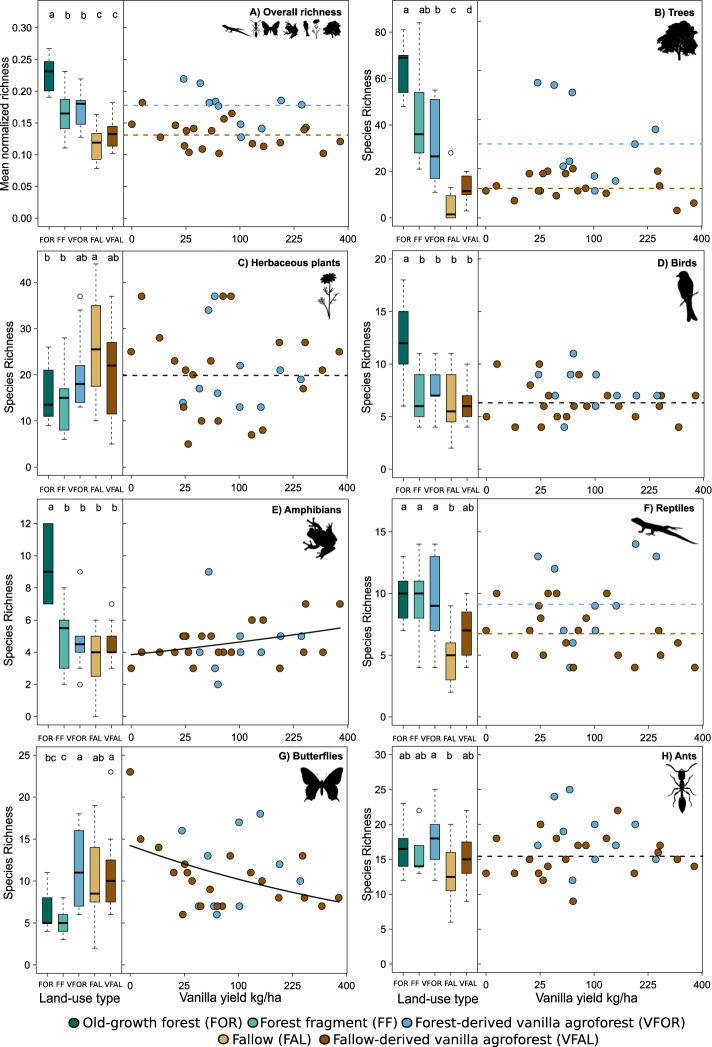
Fig. 1. Overall species richness (mean normalized richness across all taxa) and individual species richness of seven taxonomic groups across land-use types and with increasing vanilla yield.
Shown are boxplots of plot-level mean normalized richness across taxa (A) and species richness of seven taxa individually (B–H) in old-growth forest (FOR = dark green), forest fragment (FF = light green), forest-derived vanilla agroforest (VFOR = blue), fallow (FAL = yellow) and fallow-derived vanilla agroforest (VFAL = brown). n = 10 for each FOR, FF and VFOR & n = 20 for each FAL and VFAL. The line inside the boxplot represents the median of each land-use type. The lower and upper boundaries of the boxplot show the 25th–75th percentiles of the observational data, respectively, and the whiskers show the 1.5 interquartile range. Outliers are shown as dots. Letters indicate significant differences between land-use types based on pairwise Tukey’s honest or Wilcoxon significance tests (Statistical test results in Supplementary Tables 4–6). Scatterplots (VFOR = blue and VFAL = brown) show the relationship between plot-level mean normalized richness (A) and plot-level species richness of the seven taxa (B–H) with vanilla yield. Lines indicate model predictions (Statistical test results in Supplementary Tables 1 and 2). Horizontal dashed lines are intercept-only linear models (lines are based on the mean of the distribution). Solid lines indicate statistically significant relationships (p < 0.05). Two colored lines (VFOR = blue and VFAL = brown) are shown as dashed lines if land-use history was significant as an additive term but there was no significant relationship between species richness with vanilla yield. Solid colored lines indicate that the effect of vanilla yield was moderated by land-use history. Sample size: n = 70 plots for herbaceous plants, birds, amphibians, reptiles, butterflies, and ants; n = 68 plots for trees; n = 30 plots for vanilla yield. Note the sqrt-scale for vanilla yield/kg. Icons from phylopic.org (see Supplementary Table 19 for attributions).

