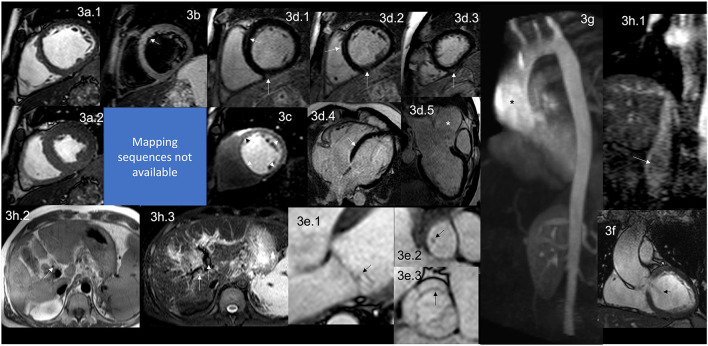
Figure 3.
CMR findings in APS. A figure demonstrates the array of findings from a comprehensive CMR study at a 1.5 Tesla scanner of APS. (a) SSFP sequence still cine images in short-axis view at the mid-ventricular level in end-diastole (a.1) and end-systole (a.2) show normal global and regional right and left ventricular functions, LVEF 63% and RVEF 56%. (b) T2-W STIR sequence in short-axis view at a mid-ventricular level shows mildly increased signal intensity in the anterior and anteroseptal segments (arrow) with a myocardial/skeletal muscle ratio of 3.6 suggestive of myocardial edema. (c) Stress CMR with FPP T1-W sequence with adenosine infusion at 140 mcg/kg/min over 6 mins showing a subendocardial circumferential perfusion defect (arrowheads) consistent with subendocardial ischemia due to endothelial dysfunction and probably to a microvascular disease (no obstructive coronary artery disease demonstrated in ICA). (d) LGE PSIR sequence. (d.1–3) short-axis views at basal (d.1), mid (d.2), and apical (d.3) levels, and long-axis views in 4-chambers (d.4) and 3-chambers (d.5) projections. The arrows in these images demonstrate areas of focal fibrosis as mid-wall LGE in the anteroseptal segment in (d.1,d.2,d.4); and in the subepicardium of the inferior segment from the base to the apex. (d.5) Shows aortic root and ascending aorta dilatation confirmed by the CE-MRA in (g) and the coronal view in SSFP still cine image (f), where it also demonstrates the presence of aortic regurgitation (arrow). (e) Zoomed still cine images in SSFP sequence of the mitral valve (e.1) and a fused asymmetric bicuspid aortic valve (e.3) Showing in a 4-chambers view a small isointense nodule in the ventricular side of the mitral valve, suggestive of Libman-Sacks endocarditis (arrow) and in the LVOT [arrow in (e.2)] (confirmed by echo), and mild thickening of the fused coronary bicuspid cusp [arrow in (e.3)]. Additionally, images (h.1–3) Show a thrombus within the portal vein and its main branches; in (h.1), a venous phase of the CE-MRA shows a contrast defect within the portal vein (arrow) consistent with a thrombus. T1-W axial view of the liver (h.2) shows a hyperintense structure within the portal system (arrow), and a T2-W STIR view of the liver (h.3) shows hypointense masses within the main portal branches (arrow) consistent with thrombus. CMR, cardiovascular magnetic resonance; SSFP, steady-state free precession; LVEF%, left ventricular ejection fraction; RVEF%, right ventricular ejection fraction; T2-W STIR, T2-weighted short-tau inversion recovery; FPP, first-pass perfusion; T1-W, T1-weighted; ICA, invasive coronary angiography; LGE, late gadolinium enhancement; PSIR, phase-sensitive inversion recovery; CE-MRA, contrast enhancement magnetic resonance angiography; LVOT, left ventricular outflow tract.

