Figure 4.
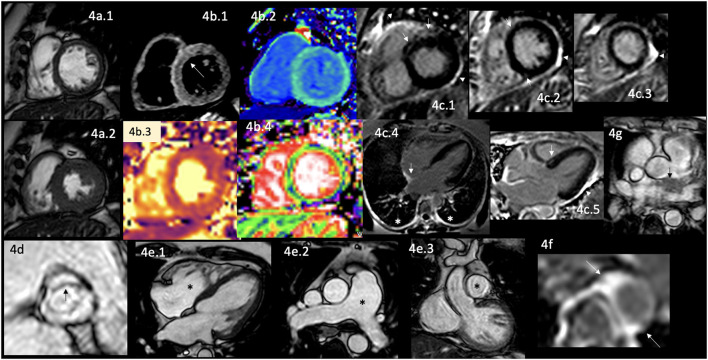
CMR findings in AR. A panel figure demonstrates varying findings from a comprehensive CMR study at a 3.0 Tesla scanner of RA with PH and arrhythmias. (a) SSFP sequence still cine images in short-axis view at the mid-ventricular level in end-diastole (a.1) and in end-systole (a.2) show normal global and regional left ventricular functions, mass, and wall thickness, LVEF 64% and moderately reduced systolic global RV function with global hypokinesia and mild hypertrophy (RV mass index 95 g/m2), RVEF 44%. (b.1) T2-W STIR sequence in short-axis view at a mid-ventricular level showing mildly increased signal intensity in the anterior, anteroseptal, and inferoseptal segments (arrow) with a myocardial/skeletal muscle ratio of 2.4 suggesting mild myocardial edema. (b.2) T1 mapping with a native T1 of 1,212 ms (normal), (b.3) T2 mapping with a T2 time of 42 msec (upper limit of normal) and (b.4) the ECV map corresponding to an elevated 52%. (c) LGE PSIR sequence. (c.1–3) Short-axis views at basal (c.1), mid (c.2), and apical (c.3) levels, and long-axis views in four-chambers (c.4) and three-chambers (c.5) projections. The arrows in these images show areas of focal fibrosis as midventricular LGE in the anteroseptal segment in (c.1,2) and the subepicardium of the anterior segment in (c.1) and subepicardial in the inferior segment in (c.2). (c.4) Shows LGE on the upper RA wall (arrow) and both-sided pleura (asterisks). (c.5) Shows mid-wall LGE on the anteroseptal segment. Pericardial LGE is shown in (c.1–3,5) (arrowheads), consistent with pericardial inflammation in the absence of pericardial effusion. (d) Zoomed still cine image in SSFP sequence of the aortic valve showing cusps thickening (arrow) with a mildly reduced valvular area (1.57 cm2). (e.1–3) SSFP sequence still cine images in long-axis 4-chambers view (e.1) showing RV enlargement (asterisks), (e.2) true axial view at great vessels level showing a mildly enlarged PA (asterisks) confirmed in the corresponding coronal view (e.3). (f) Zoom LGE PSIR image of the descending aorta showing wall artery enhancement (arrows). (g) SSFP sequence still cine images in the true axial view show an isointense tissue between the aortic root and the LA, probably of a granulomatous origin (arrow). CMR, cardiovascular magnetic resonance; RA, rheumatoid arthritis; SSFP, steady-state free precession; LVEF%, left ventricular ejection fraction; RVEF%, right ventricular ejection fraction; T2-W STIR, T2-weighted short-tau inversion recovery; ECV, extracellular volume; T1-W, T1-weighted; LGE, late gadolinium enhancement; PSIR, phase-sensitive inversion recovery; PA, pulmonary artery; LA, left atrium.

