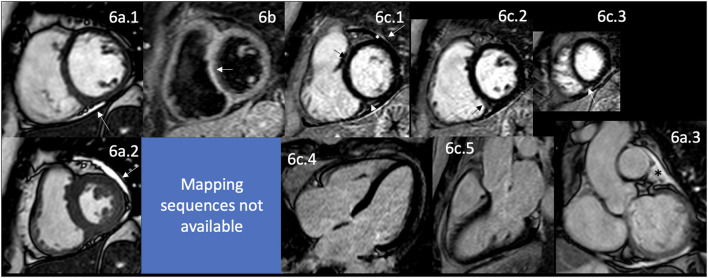
Figure 6.
CMR findings in DS. A panel figure demonstrates varying findings from a comprehensive CMR study at a 1.5 Tesla scanner of DS. (a) SSFP sequence still cine images in short-axis view at the mid-ventricular level in end-diastole (a.1) and end-systole (a.2) show normal global and regional functions of the left ventricle, LVEF 63% and mildly reduce systolic global RV function and mild global hypokinesia RVEF 45%. (a.3) In a coronal view showing the mild pericardial effusion surrounding the heart (asterisks). (b) T2-W STIR sequence in short-axis view at a mid-ventricular level showing increased signal intensity in the septal segments (arrow) with a myocardial/skeletal muscle ratio of 2.3, suggesting mild myocardial edema. (c.1–5) LGE PSIR sequence. (c.1–3) Short axis views at basal (c.1), mid (c.2), and apical (c.3) levels, and long-axis views in four-chambers (c.4) and three-chambers (c.5). The arrows in these images show areas of focal fibrosis as midventricular LGE of the anteroseptal and inferior segments in (c.1) and in the subepicardium of the inferior segment in (c.2,3). (c.1) Shows mild pericardial effusion (asterisks) and trivial pericardial enhancement (arrow), suggesting minimal pericardial inflammation. CMR, cardiovascular magnetic resonance; DS, DRESS syndrome; SSFP, steady-state free precession; LVEF%, left ventricular ejection fraction; RVEF%, right ventricular ejection fraction; T2-W STIR, T2-weighted short-tau inversion recovery; LGE, late gadolinium enhancement; PSIR, phase-sensitive inversion recovery.

