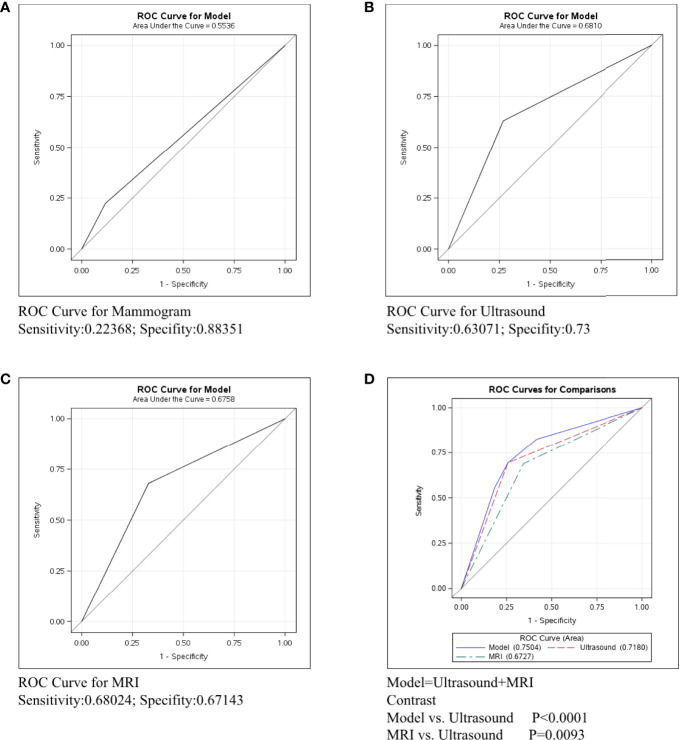
Figure 1.
ROC curve analysis for specific imaging examination in all molecular subtypes. The vertical axis is sensitivity, the horizontal axis is 1-specificity. AUC is a parameter used to measure the value of imaging examination in the prediction of axillary lymph nodes. (A) ROC curve for mammogram. (B) ROC curve for ultrasound. (C) ROC curve for MRI. (D) ROC curve for ultrasound+MRI.

