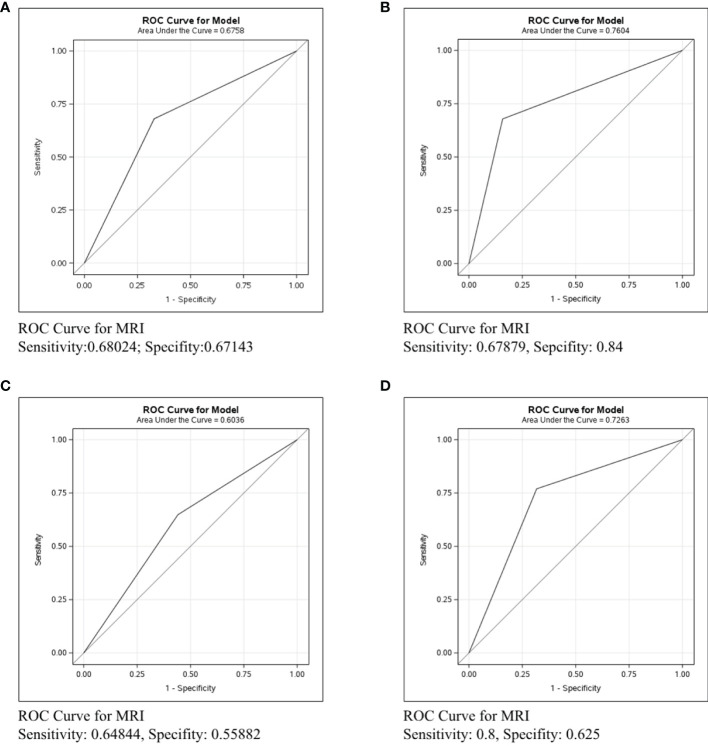
Figure 7.
ROC curve analysis for MRI in all molecular subtypes. The vertical axis is sensitivity, the horizontal axis is 1-specificity. AUC is a parameter used to measure the value of MRI in the prediction of axillary lymph nodes. (A) ROC curve in all molecular subtypes. (B) ROC curve in ER/PR+Her2- subtype. (C) ROC curve in Her2+ subtype. (D) ROC curve in ER/PR-Her2- subtype.

