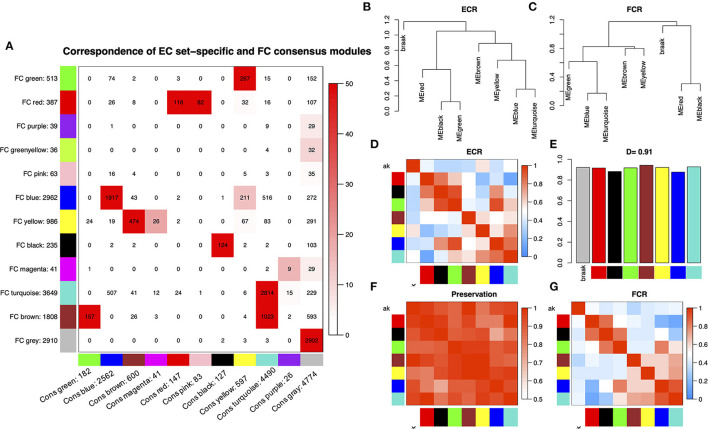
Figure 1.
(A) Comparison between EC set-specific modules and EC-FC consensus modules of the global co-expression network. The numbers in the table represent genes that are shared between EC modules and consensus modules. The color code of the table is -log(p), where p is the p-value of Fisher's exact test of the overlap of the two modules. The darker the red, the more pronounced the overlap. (B,C) Clustering dendrograms of consensus module eigengenes for identifying meta-modules show the presence of similar major branching patterns in the EC and FC eigengene network. (D,G) The heatmap shows the eigengene adjacencies in EC and FC eigengene networks. Each row and column correspond to an eigengene tagged by consensus module color. Within each heatmap, red represents high adjacency (positive correlation) and blue represents low adjacency (negative correlation) as represented by the color legend. (E) Bar plot shows the preservation degree of each consensus eigengene as the height of the bar (y-axis) where each colored bar corresponds to the eigengene of the associated consensus module. The high-density value D (Preserve EC, FC) = 0.91 indicates the high overall preservation between the EC and FC networks. (F) Adjacency heatmap of the preservation network between EC and FC consensus eigengene networks. The saturation of the red color indicates a correlation preservation of EC and FC module eigengenes.

