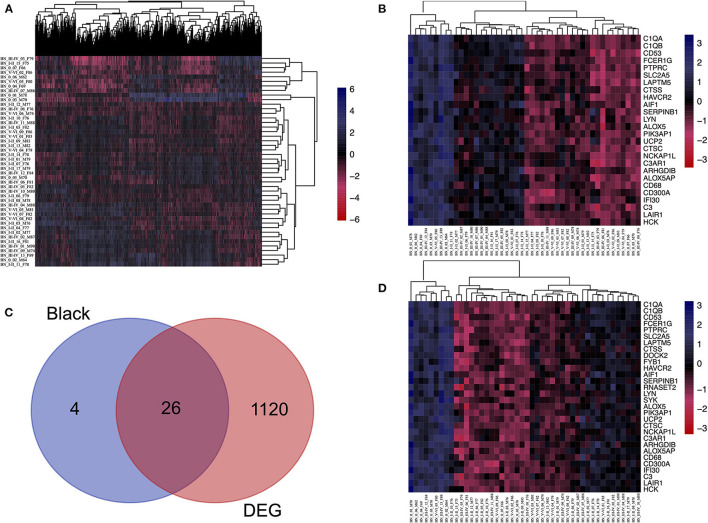
Figure 3.
Identifying the overlapping genes between downregulated DEGs in the aged group and genes in the black module. (A) Heatmap of the expression of DEGs. (B) Heatmap of the Top30 gene expression in the black module. (C) Using veen tools to find the overlap genes between downregulated genes in DEGs and genes in the black module. (D) Heatmap showing the expression of the overlapping genes in different samples.

