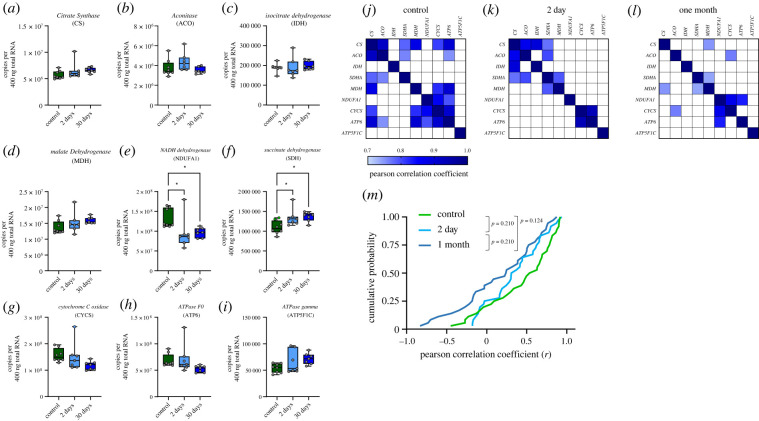
Figure 5.
Genes involved in aerobic metabolism reduce co-expression during hibernation. (a–i) Mean copy number of genes involved in the Krebs cycle and electron transport chain (ETC). The box spans from the 25th to 75th percentiles, and the median is presented as a horizontal line. Each individual data point is denoted by open circles. Significant differences between control and experimental groups are denoted with asterisks (one-way ANOVA test followed by Holm–Sidak's multiple comparison test). (j–l) Changes in co-expression across Krebs cycle and ETC genes throughout hibernation, with (m) illustrating the cumulative distribution in Pearson correlation coefficients. *p < 0.05. (Online version in colour.)

