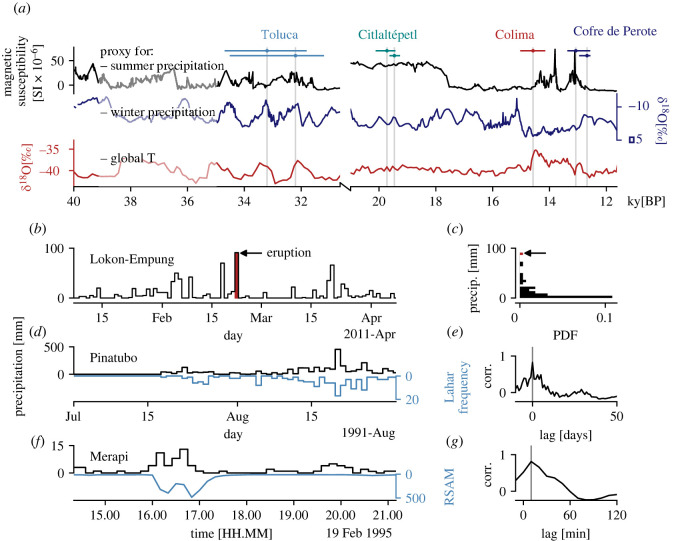
Figure 1.
Extreme rainfall as a driver of volcanic hazards. (a) Pleistocene volcanic sector collapses of Volcán de Colima, Nevado de Toluca, Citlaltépetl and Cofre de Perote (Mexico), reproduced after Capra et al. [39]. Climate proxy data are described in the Material and methods. For each of the seven collapses, horizontal date ranges are indicated, as well as a vertical line highlighting the maximum probability collapse date. Note discontinuous x-axis. (b) The February 2011 eruption of Lokon-Empung is shown by a vertical line, alongside time series of local precipitation data. (c) Log-normal distribution of precipitation data from (b), with outlying value (corresponding to date of eruption) indicated. (d) Daily precipitation data (black) is plotted against the number of lahars per day (blue) observed at Pinatubo between July and September 1991. (e) Result of cross-correlation analysis of Pinatubo data shown in (d), shown as correlation coefficient (corr.) between daily precipitation and lahar frequency versus lag. (f) Precipitation in ten-minute bins at Merapi volcano, alongside the RSAM value at the same temporal resolution. RSAM maxima reflect peak lahar surges. (g) Result of cross-correlation analysis of Merapi data shown in (f), shown as correlation coefficient between ten-minute precipitation and RSAM value versus lag. Refer to Material and methods for all data sources.

