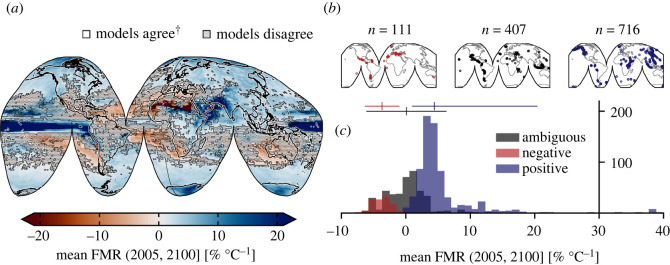
Figure 2.
Breakdown of mean forced model response. (a) Global mean forced model response (FMR) calculated from all models. Shaded area indicates those regions where fewer than seven of nine models agreed on the sign of change (26.55%). †At least seven of nine models agree on the sign of change. (b) Subaerial volcano geolocations separated according to whether models agree on a decrease in heavy precipitation with increased warming (red: ‘negative’; n = 111); the precipitation response is ambiguous due to lack of model agreement (black: ‘ambiguous’; n = 407); models agree on an increase in heavy precipitation with increased warming (blue: ‘positive’; n = 716). n indicates the number of discrete Holocene-active volcanic systems in each category. (c) Histogram of mean FMR for each group of volcanoes (as in (b)). Mean and two standard deviation range are indicated by the vertical and horizontal lines, respectively (Material and methods).

