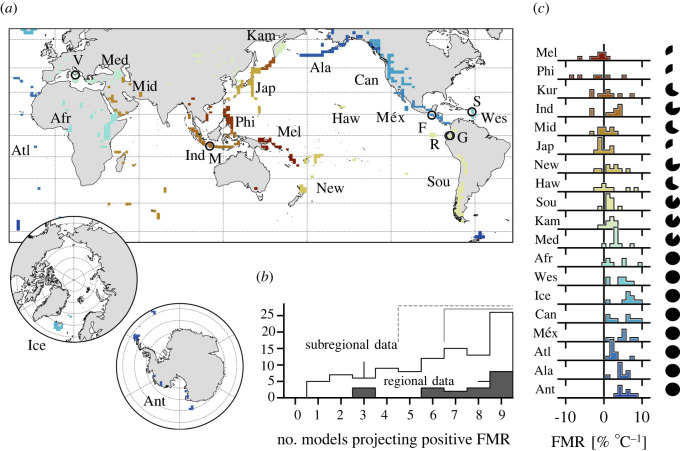
Figure 3.
Regional and sub
regional spatial averages. (a) Map indicating the non-contiguous spatial extent over which regional data are averaged. Circle markers indicate individual volcanoes shown in figure 4. V, Vesuvius; M, Merapi; F, Fuego; R, Reventador; G, Guagua Pichincha; S, Soufrière Hills Volcano. [Inset] polar regions. Regions are represented by discrete coloured rectilinear polygons. Ant, Antarctica; Atl, Atlantic Ocean; Sou, South America; Ala, Alaska; Kur, Kuril Islands; Ind, Indonesia; Mid, Middle East and Indian Ocean; Phi, Philippines and SE Asia; Méx, México and Central America; Jap, Japan, Taiwan and Marianas; Kam, Kamchatka and Mainland Asia; Med, Mediterranean and Western Asia; New, New Zealand to Fiji; Haw, Hawai`i and Pacific Ocean; Ice, Iceland and Arctic Ocean; Afr, Africa and Red Sea; Wes, West Indies; Mel, Melanesia and Australia; Can, Canada and Western USA. (b) Bar chart of the number of regions and subregions where x number of models project a spatially averaged forced model response (FMR) > 0 (i.e. a concomitant increase in heavy precipitation and global mean temperature). Dashed bracket indicates the majority of models, solid bracket indicates seven or more out of nine models. (c) Inter-model distributions of calculated FMR for each region. Marginal pie charts indicate the proportion of models that project a positive FMR per region (out of maximum of nine).

