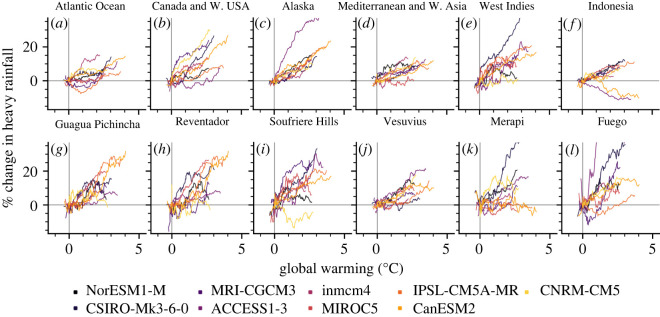
Figure 4.
Forced model responses at different spatial scales. (a–f) Per cent change in modelled heavy rainfall per degree of global warming. Data are shown as a 30-year rolling mean, normalized to January 2021. Data are areal averages (figure 3 for areal extent of each region). (g–l) As (a–f), for individual volcanic systems. Data correspond to the bounding pixel for each model (see Material and methods). Volcano locations are shown in figure 3.

