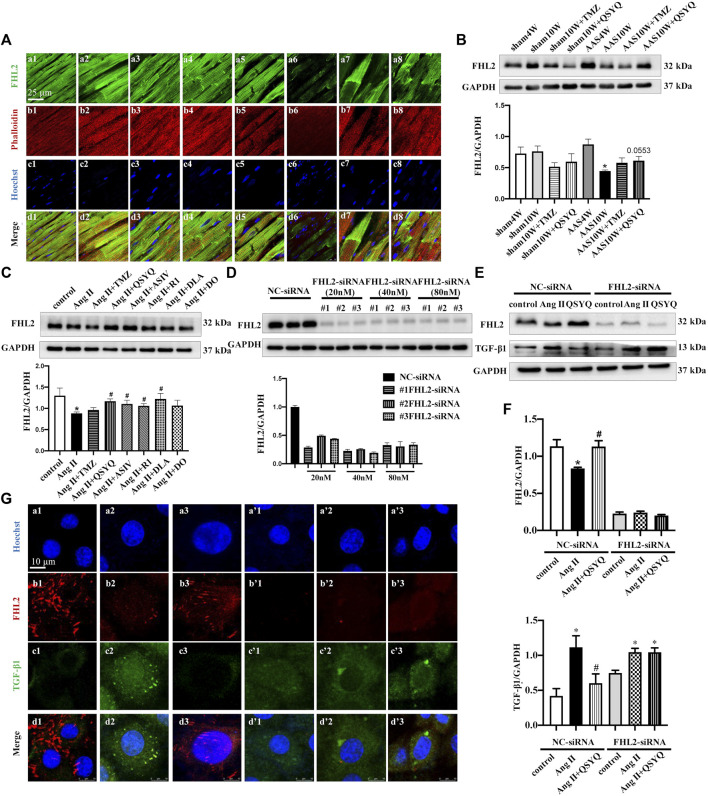
FIGURE 8.
QSYQ inhibited cardiac myocyte release of TGF-β1 in a FHL2 dependent manner. (A) Immunofluorescence images of FHL2, phalloidin, and nuclei in rat myocardium in the Sham4W (a1, b1, c1, and d1), Sham10W (a2, b2, c2, and d2), Sham10W + TMZ (a3, b3, c3, and d3), Sham10W + QSYQ (a4, b4, c4, and d4), AAS4W (a5, b5, c5, and d5), AAS10W (a6, b6, c6, and d6), AAS10W + TMZ (a7, b7, c7, and d7), and AAS10W + QSYQ (a8, b8, c8, and d8) groups. Bar = 25 μm. (B) Expression of FHL2 in rat myocardium examined by Western blot with quantification shown below. (C) Expression of FHL2 in 1 µM Ang II stimulated H9C2 cells examined by Western blot, with quantification shown below. (D) Expression of FHL2 in FHL2 knock-downed H9C2 cells using siRNA examined by Western blot, with quantification shown below. (E) Expression of FHL2 and TGF-β1 in FHL2 knock-down H9C2 cells examined by Western blot. (F) Quantification of the results presented previously. Data are presented as the mean ± SEM, n = 4. * p < 0.05 vs. sham or control; # p < 0.05 vs. AAS or Ang II. (G) Immunofluorescence images of FHL2, TGF-β1, and nucleus in H9C2 cells in NC-siRNA: NC (a1, b1, c1, and d1), Ang II (a2, b2, c2, and d2), Ang II + QSYQ (a3, b3, c3, and d3) and FHL2-siRNA: NC (a’1, b’1, c’1, and d’1), Ang II (a’2, b’2, c’2, and d’2), and Ang II + QSYQ (a’3, b’3, c’3, and d’3). Scale bar = 25 μm.

