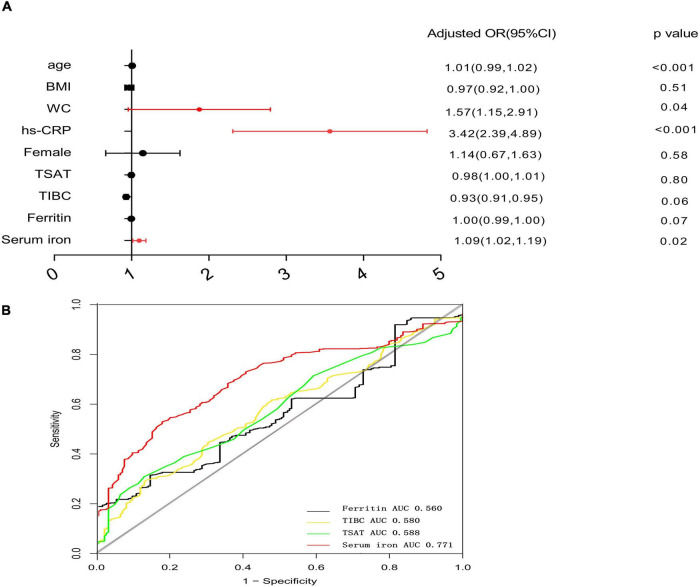
FIGURE 1.
Forest plots for multivariate logistic analysis of variables for high A/G ratio and receiver-operating characteristic curve analysis of iron metabolism biomarkers for high A/G ratio. (A) Multivariate analysis: adjusted OR after adjustment for age, gender, BMI, WC, and high-sensitivity C-reactive protein (hs-CRP). (B) ROC analysis of iron metabolism biomarkers for a high A/G ratio. The cutoff value of serum iron for high A/G ratio was defined as the optimal sensitivity and specificity of the ROC curve. OR, odds ratio; ROC, receiver operating characteristic analysis; and A/G ratio, android-to-gynoid fat ratio.

