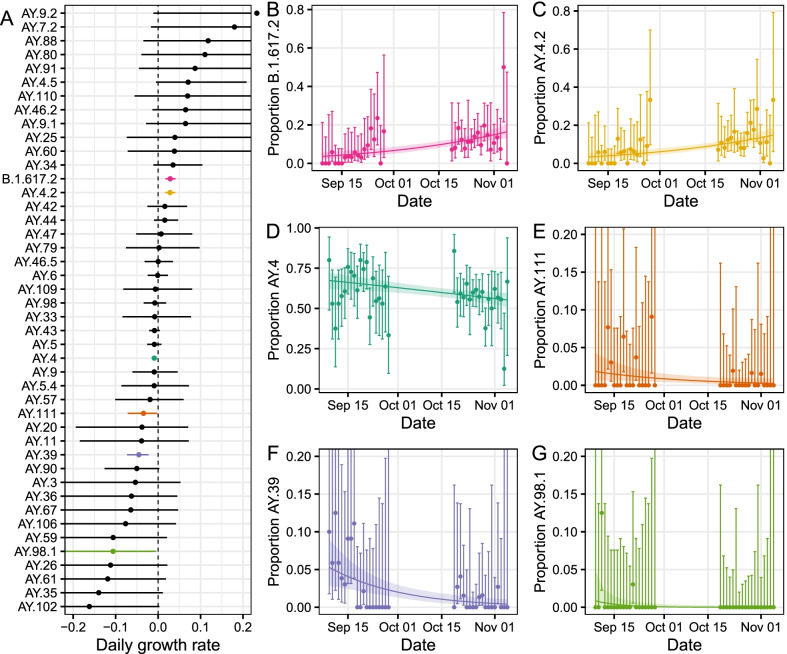
Fig. 3.
A Estimated daily growth rate of the log odds of each lineage detected relative to all other lineages. Shown are both lineages with a growth rate in proportion not significantly different to zero (black) and those with a growth rate in proportion significantly different to zero (coloured). B–G Raw estimates of the daily proportions (points) with 95% confidence intervals (error bars) for lineages with a growth rate in proportion significantly different to zero: B.1.617.2 (B, pink), AY.4.2 (C, yellow), AY.4 (D, dark green), AY.111 (E, orange), AY.39 (F, purple), AY.98.1 (G, light green). Also shown is the best-fit Bayesian logistic regression model with central estimate (solid line) and 95% credible interval (shaded region)

