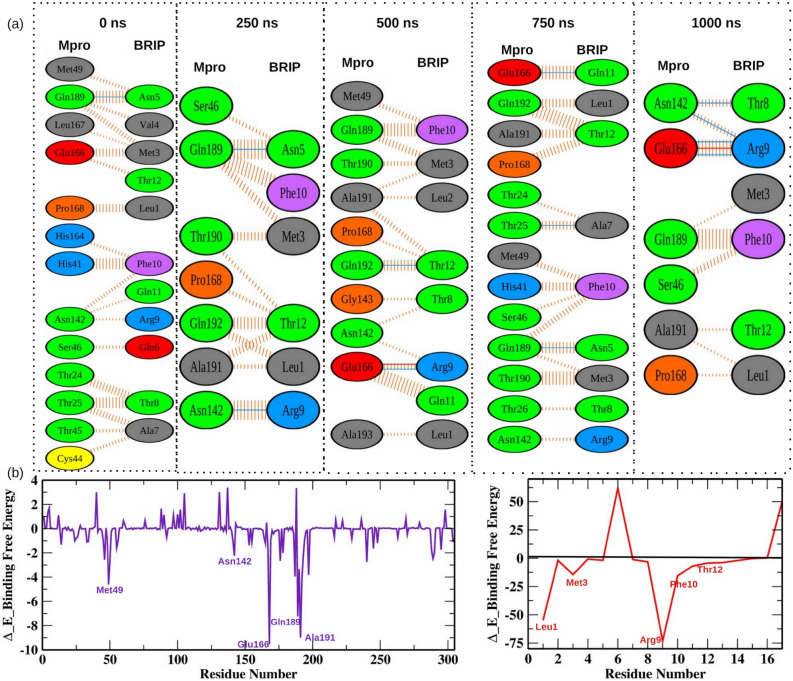
Figure 6.
The key residues involved in Mpro-BRIP interactions. (a) The interaction profiles of static poses extracted at different time intervals during the simulation. The solid blue and red color lines represents hydrogen bonds and salt bridges respectively, while the striped lines denote non bonded interactions. The residue color coding scheme is as follows: positive (blue), negative (red), neutral (green), aliphatic (gray), aromatic (purple), proline and glycine (orange). (b) The per residue contribution energy of Mpro and BRIP observed for the entire simulation run by the MM-PBSA method.

