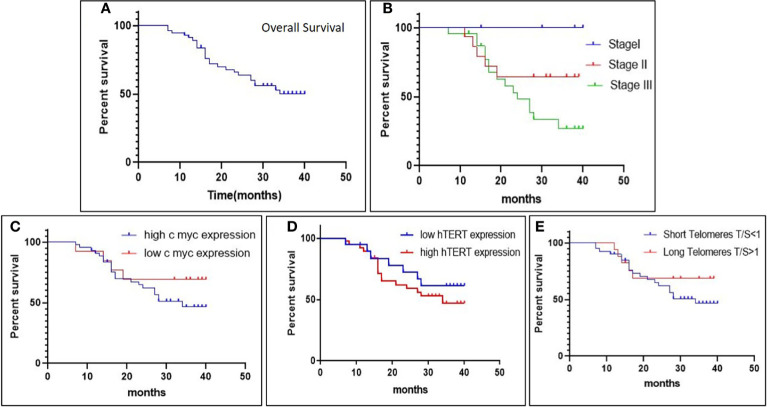
Figure 5.
The Kaplan–Meier survival plot depicts (A) overall survival (OS) in gastric cancer patients; (B) overall survival (OS) in different stages; (C, D) association of overall survival (OS) with c-Myc expression and hTERT expression; and (E) association of overall survival (OS) with relative telomere length.

