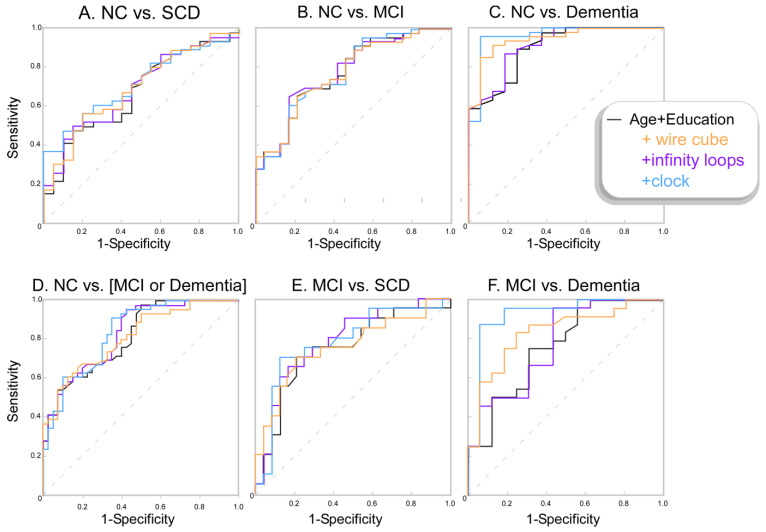
Figure 2.
ROC curves showing the sensitivity and specificity of the different binomial logistic model probabilities. The model including only age and years of education is shown in black. The model with the wire cube test included (i.e., age and education and wire cube score) is shown in orange. The model with infinity loops included (age and education and infinity loops score) is shown in purple, and the model with the CDT (age & education & CDT score) is shown in blue.

