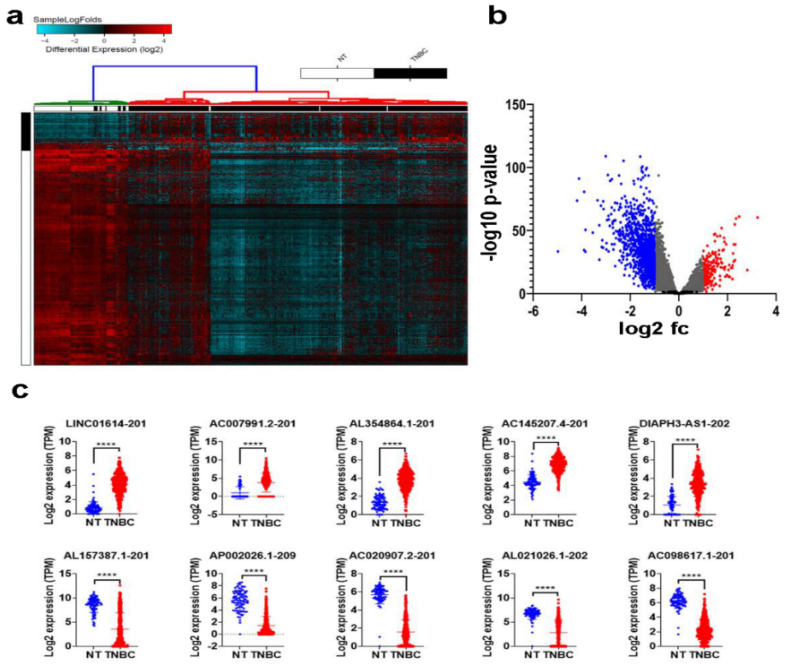
Figure 1.
Differentially expressed lncRNAs in TNBC compared to normal breast tissue (NT). RNA-Seq data were aligned to the human geocode release v33, and the abundance of each lncRNA transcript was quantified. (a) Hierarchical clustering of TNBC (n = 360) compared to NT (n = 88). Each column represents one sample, and each row represents the lncRNA transcript. The expression level of each transcript (log2) is depicted according to the color scale. (b) Volcano plot depicting upregulated (red) and downregulated (blue) lncRNAs in TNBC compared to NT. (c) Scatter plot depicting the expression of the top 5 upregulated (upper panel) and downregulated (lower panel) lncRNA transcripts in TNBC compared to NT. **** p < 0.00001.

