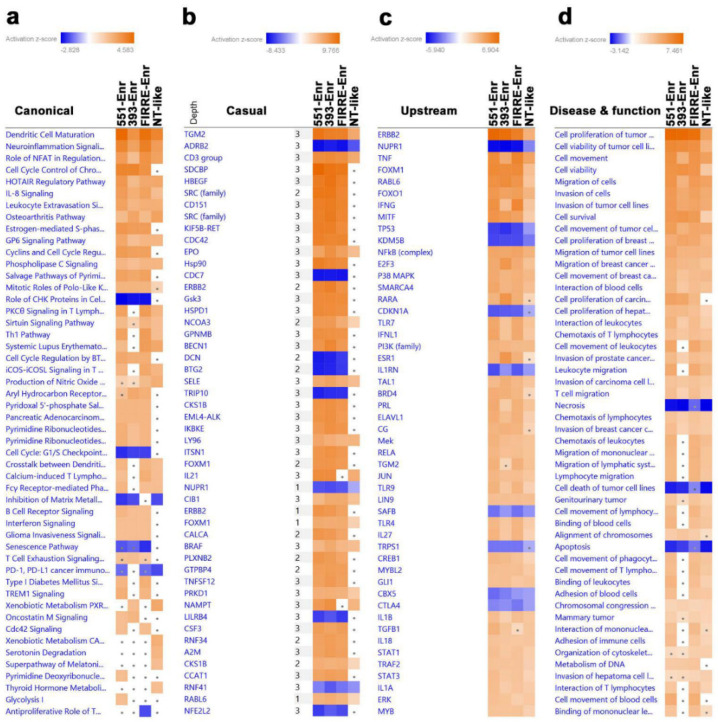
Figure 4.
Upstream regulator and functional annotation enrichment in lncRNA-derived TNBC clusters. Upregulated genes from each lncRNA-derived TNBC cluster compared to NT were subjected to comparative casual (a), canonical (b), upstream (c), and disease and function (d) analysis using IPA illustrating the top affected categories. Color intensity corresponds to the activation Z-score. 551-Enr, LINC00511-enriched; 393-Enr, LINC00393-enriched; FIRRE-Enr, FIRRE-enriched; NT-like, normal tissue-like; NT, normal tissue.

