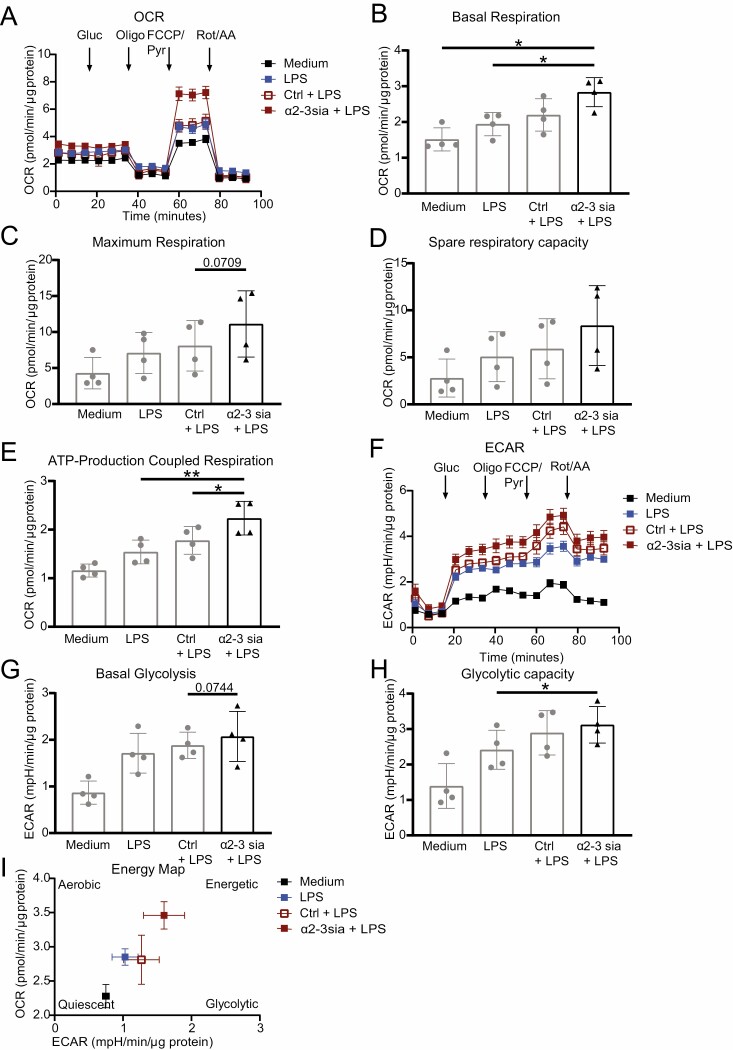
Figure 4.
Metabolic extracellular flux analysis reveals an increased oxygen consumption rate (OCR) and basal extracellular acidification rate (ECAR) in α2-3sia dendrimer and LPS stimulated moDCs. (A) OCR of one representative of four independent donors is depicted (n = 5–6 replicates ±SEM, normalized based on protein content). From the OCR of all four donors the basal respiration (B), the maximum respiration (C), spare respiratory capacity (D), and ATP-production-coupled respiration (E) were calculated and depicted as mean ± SD. (F) ECAR of one representative of four independent donors is depicted (n = 5–6 replicates ±SEM, normalized based on protein content). From the ECAR of all four donors the basal glycolysis (G) and glycolytic capacity (H) were calculated and shown as mean ±SD. (I) Energy map using ECAR and OCR reveals a more energetic moDC stimulated with α2-3sia dendrimers and LPS compared with LPS only or LPS and control dendrimer stimulated moDCs. Difference between the groups was tested with a paired one-way ANOVA followed by a Holm Sidak multiple comparison test. * = P ≤ 0.05, ** = P < 0.01.

