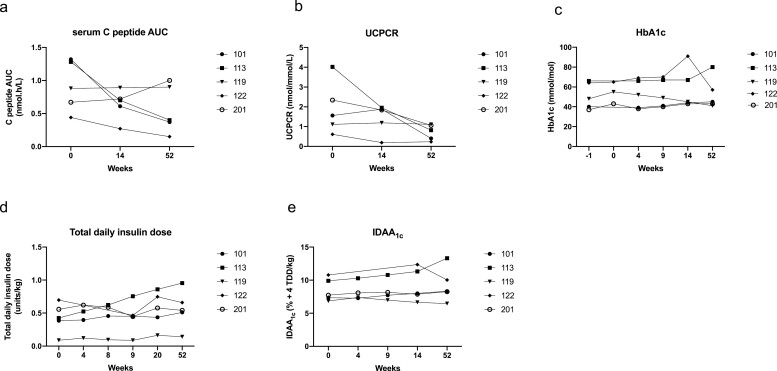
Figure 2.
Effect of C19-A3 GNP on β-cell function and metabolic parameters. (a) Serum C-peptide expressed as area under the curve (AUC) over 120 min after mixed-meal challenge; (b) urine C-peptide to creatinine ratio (UCPCR) 2 h after mixed meal; (c) HbA1c; (d) median total daily insulin dose recorded over 3 days before the study visit and normalised for body weight; (e) insulin dose-adjusted A1c (IDAA1c) calculated according to the formula: HbA1c (%) + [4× insulin dose (units per kg per 24 h)]. Each line represents an individual participant with an assigned study number as shown in the legend.

