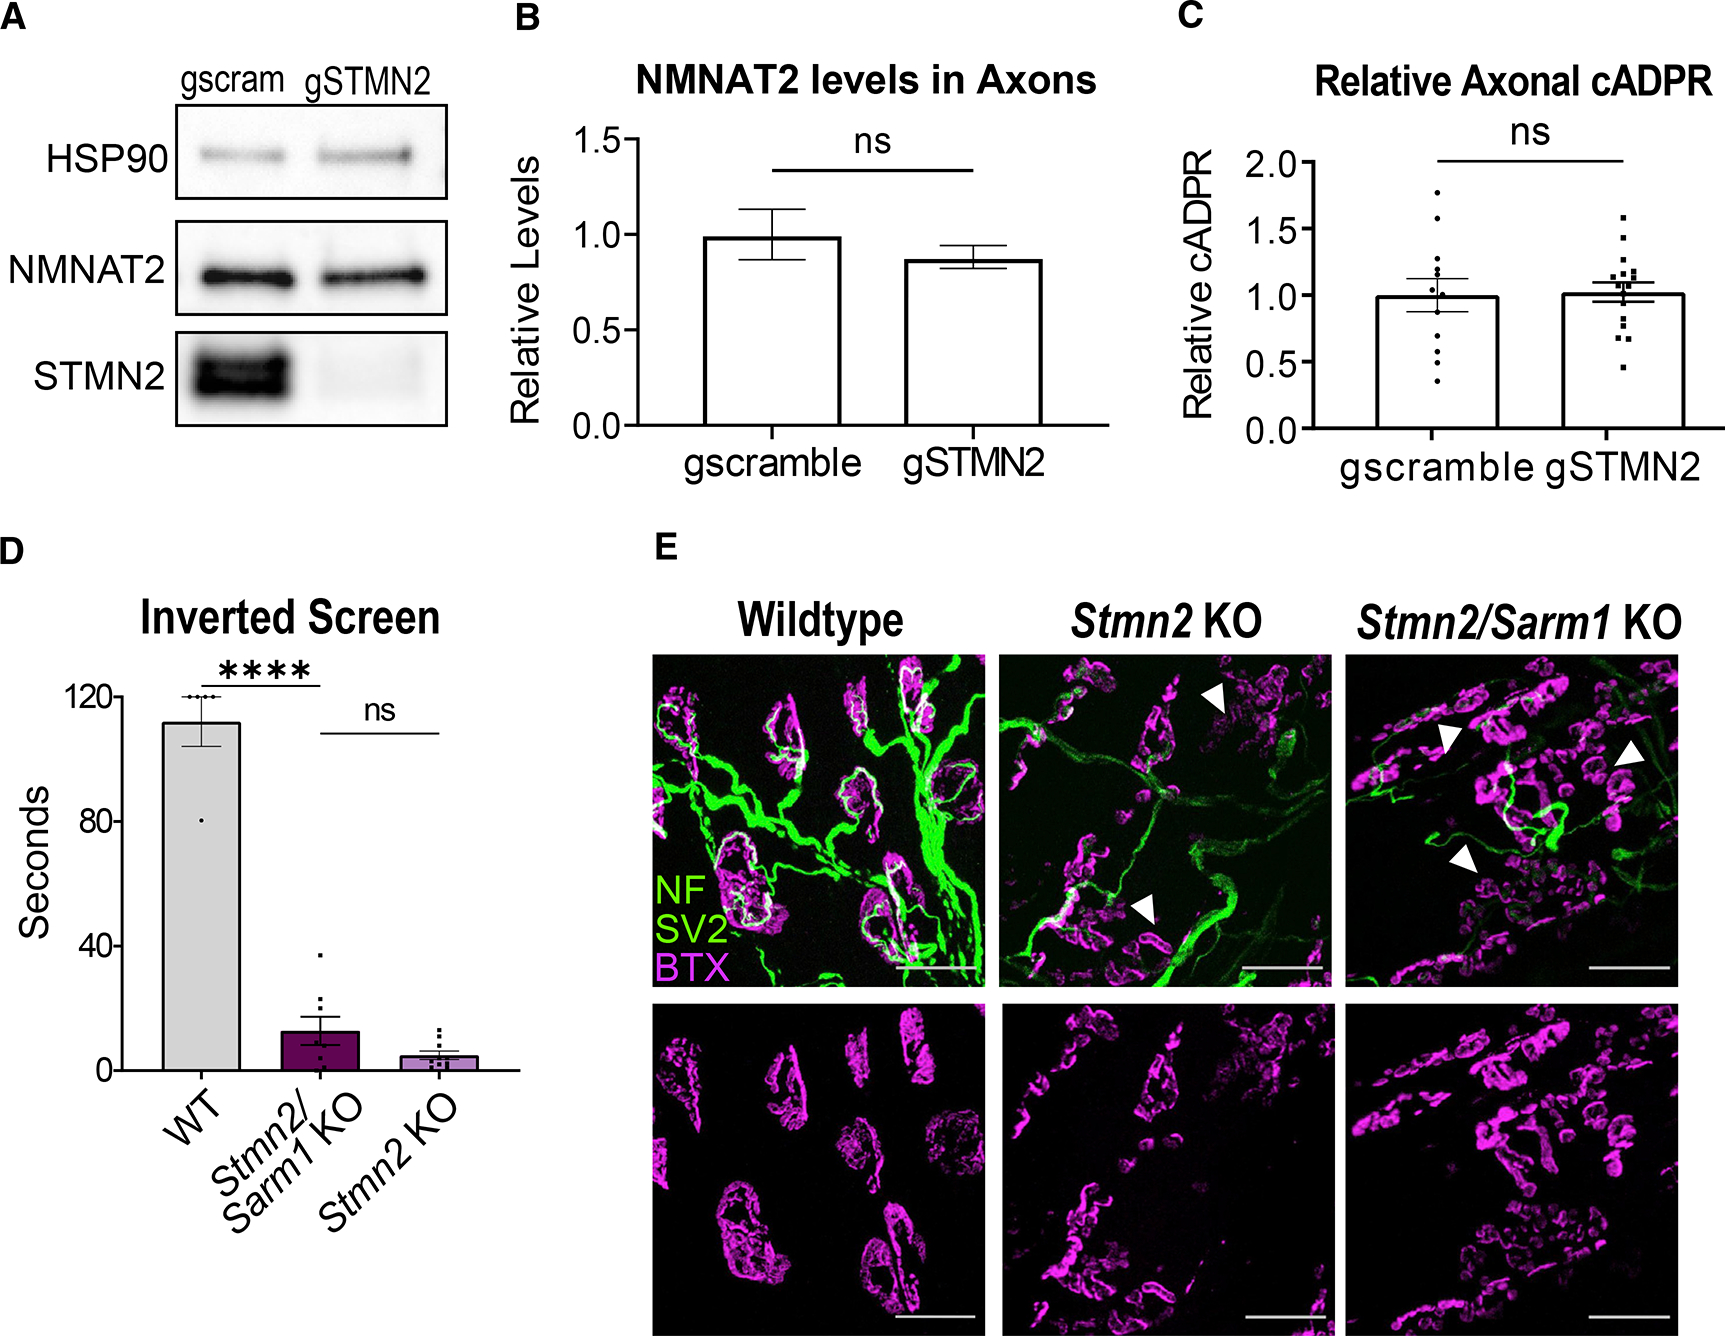
Figure 4. Phenotypes associated with STMN2 loss are not mediated by SARM1 activation.

(A) Representative western blots of NMNAT2 and STMN2 using axonal lysates from neurons derived from Cas9 transgenic mice infected with lentivirus expressing Stmn2 or scrambled control gRNAs.
(B) Relative NMNAT2 protein band intensity (n = 4 experiments).
(C) Average relative cADPR levels from axonal lysates from neurons derived from Cas9 transgenic mice infected with lentivirus expressing Stmn2 (n = 16) or scrambled control (n = 12) gRNAs. Statistical significance determined by the Student unpaired t-test.
(D) Latency time to fall from an inverted screen (max. 120s) for WT (n = 5), Stmn2/Sarm1 KO (n = 8), and Stmn2 KO (n = 10, from Figure 2) animals. Statistical significance determined by one-way ANOVA with Tukey’s multiple comparison test.
(E) Representative images of lumbrical NMJs from WT, Stmn2/Sarm1 KO, and Stmn2 KO mice. NMJs visualized by neurofilament/SV2 (green) and bungarotoxin (magenta). Arrows point to fragmented and denervated AChR clusters. Scale bar, 25 μm. All data are presented as mean ± SEM. ns, not significant. ****p < 0.0001.
