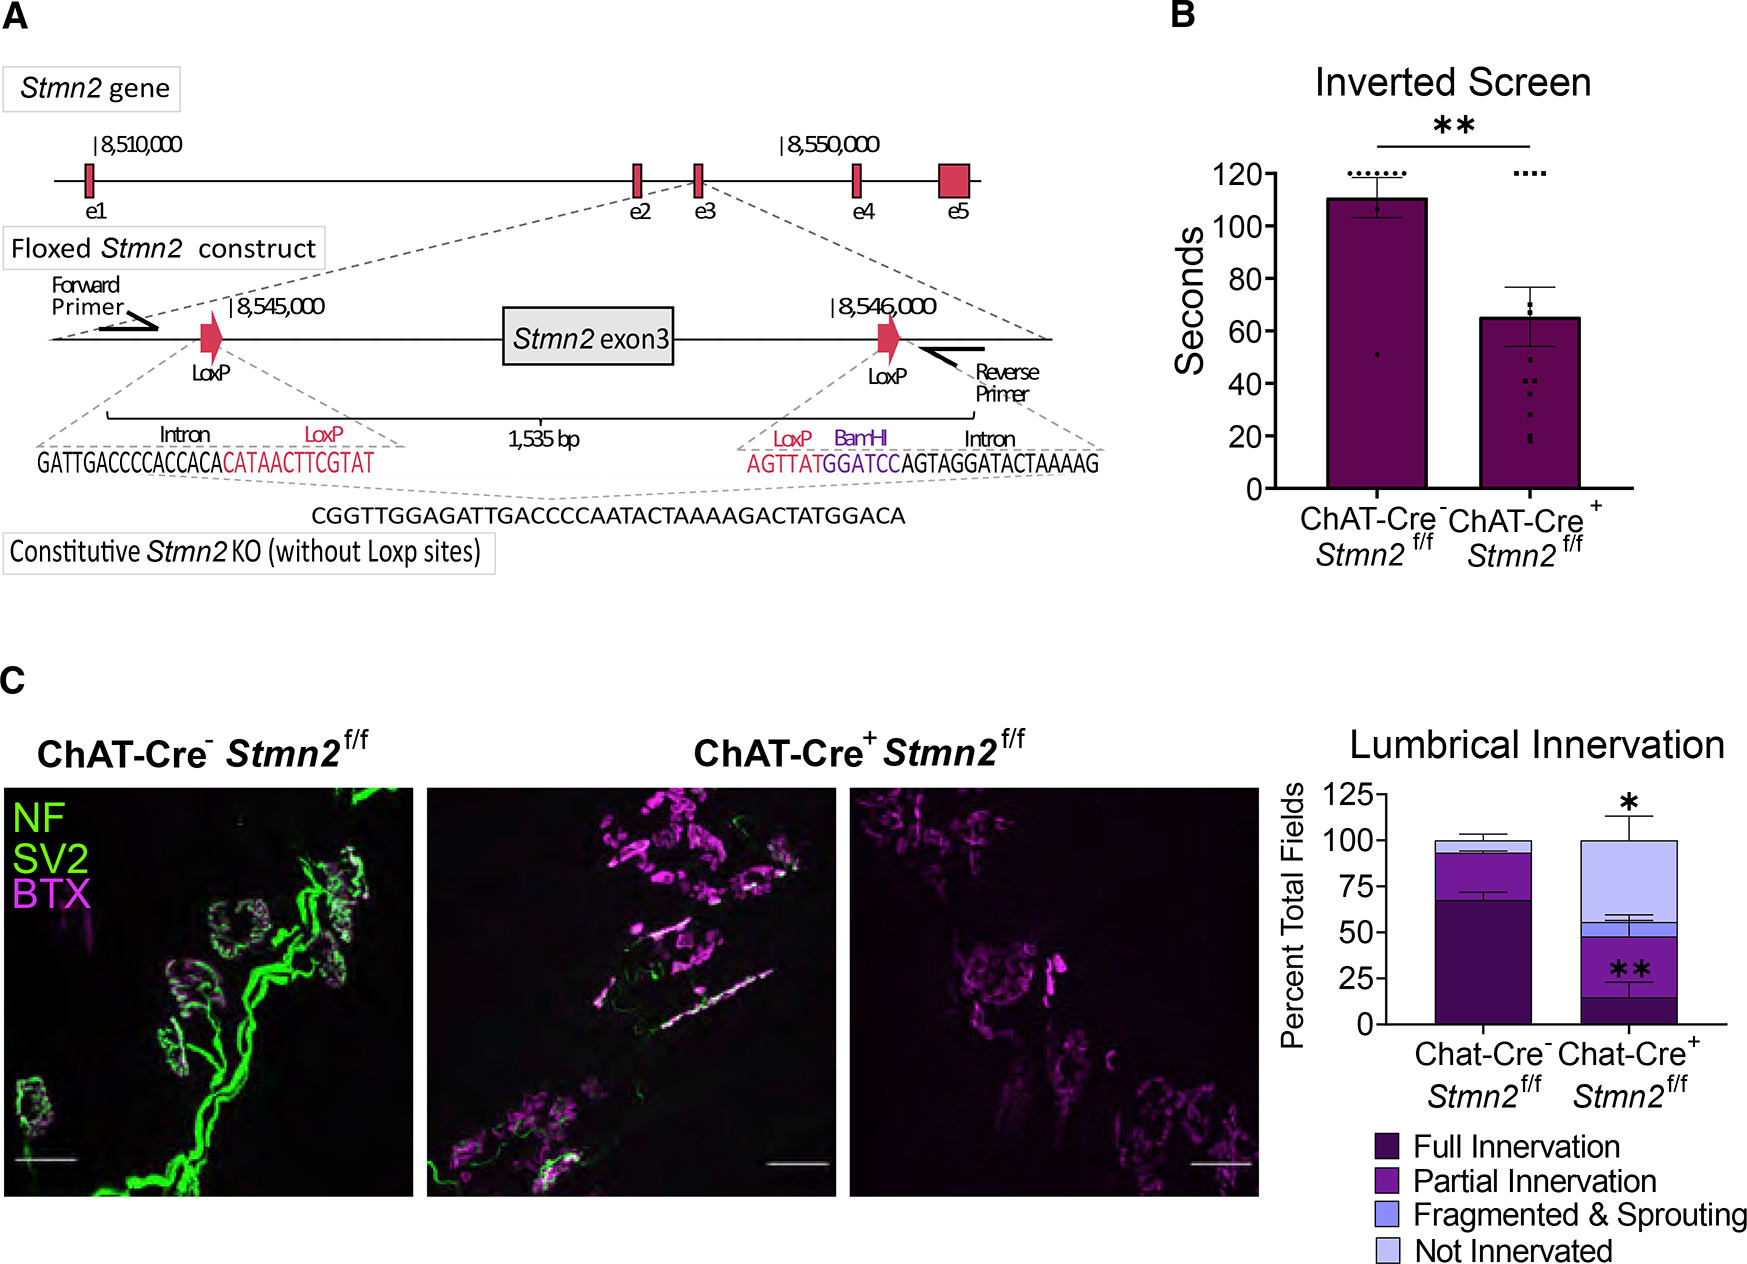
Figure 5. Stmn2 KO in motor neurons causes motor pathology.

(A) Schematic of floxed Stmn2 allele.
(B) Latency time to fall from an inverted screen (max. 120 s) for ChAT-Cre−/Stmn2f/f (n = 9) and ChAT-Cre+/Stmn2f/f (n = 13) mice at 3 months of age. Statistical significance was determined by the Student unpaired t-test.
(C) Representative images of NMJs from 3-month-old ChAT-Cre−/Stmn2f/f (n = 3) and ChAT-Cre+/Stmn2f/f (n = 6) lumbrical muscles. NMJs were visualized by neurofilament/SV2 (green) and bungarotoxin (magenta) staining. Scale bar, 25 μm. Quantification is to the right. All data are presented as mean ± SEM. *p < 0.05, **p < 0.01. See also Figure S4.
