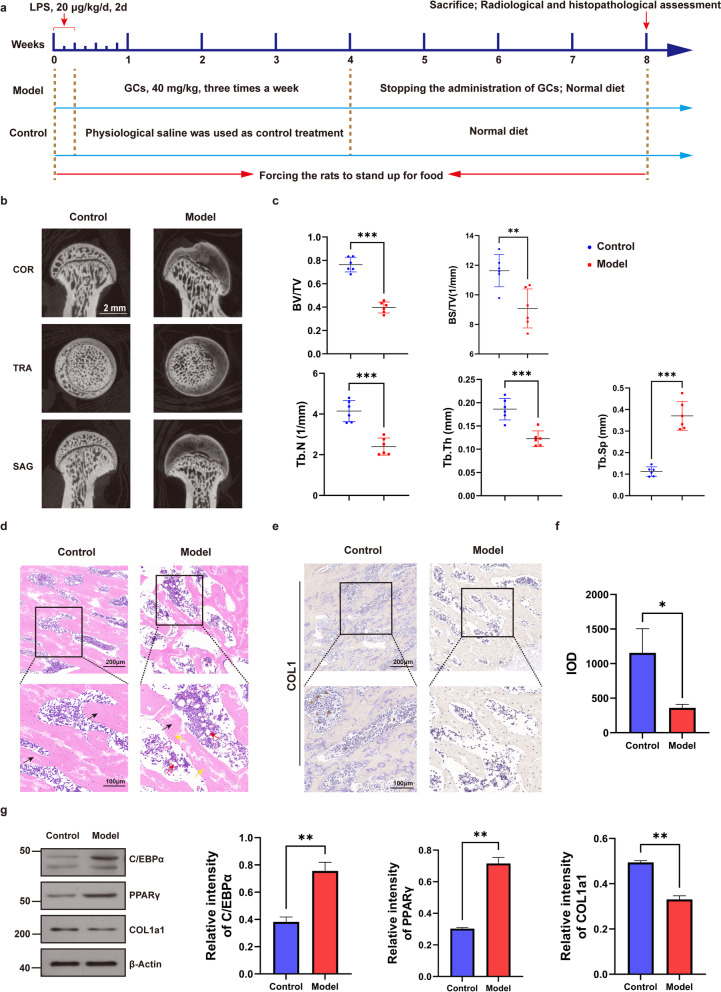
Fig. 1.
Establishment and evaluation of SANFH rat models. a Scheme of animal treatments. b The coronal (COR), transverse (TRA) and sagittal (SAG) sections of the femoral head were reconstructed by the micro-CT images in the control and model groups. c Quantitative analysis of related parameters of micro-CT. d H&E staining of the femoral head after decalcification, with black arrows indicating trabecular bone, red arrows indicating fat vacuoles, and yellow arrows indicating empty bone lacunae. e, f IHC staining of COL1 in the femoral head and quantitative analysis showed the IOD in the control and model groups. g The expression levels of femoral head-related proteins in the control and model groups were detected by western blotting, and β-actin was used for normalization and quantitative analysis by ImageJ. ***P < 0.001, **P < 0.01, *P < 0.05

