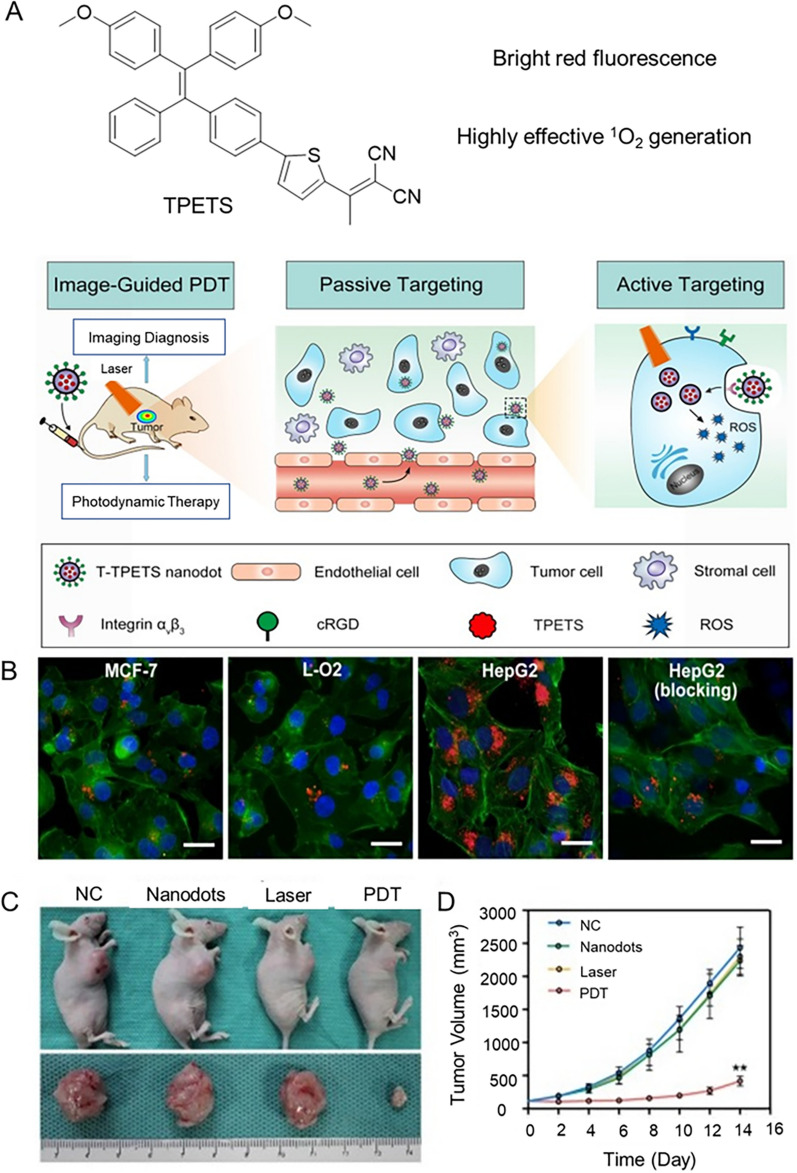
Fig. 14.
A The structure of TPETS and schematic illustration image-guided PDT mediated by T-TPETS nanodots in xenograft tumor model. B Confocal images of MCF-7, L-O2, and HepG2 cells after incubated with the T-TPETS nanodots. Red fluorescence: T-TPETS nanodots. Blue fluorescence: nuclei, green fluorescence: cytoskeleton. Scale bar: 20 μm. C Photographs of xenografts and tumors after different treatments. D Changes in tumor volume at different time points after treatment in the 4 groups (n = 3 per group). Data represent mean ± SD. Reproduced with permission [230].
Copyright 2019, Ivyspring International

