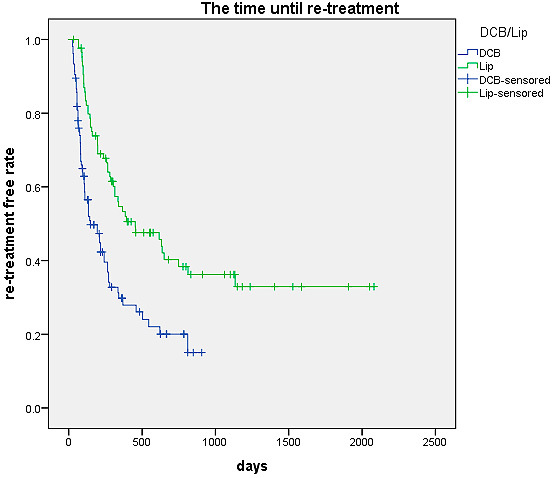
Figure 2.

Kaplan-Meier curve of the time until re-treatment
Note. Kaplan-Meier curves for the time until re-treatment showed that the time until re-treatment in the cTACE group was significantly longer (P<0.001).

Kaplan-Meier curve of the time until re-treatment
Note. Kaplan-Meier curves for the time until re-treatment showed that the time until re-treatment in the cTACE group was significantly longer (P<0.001).