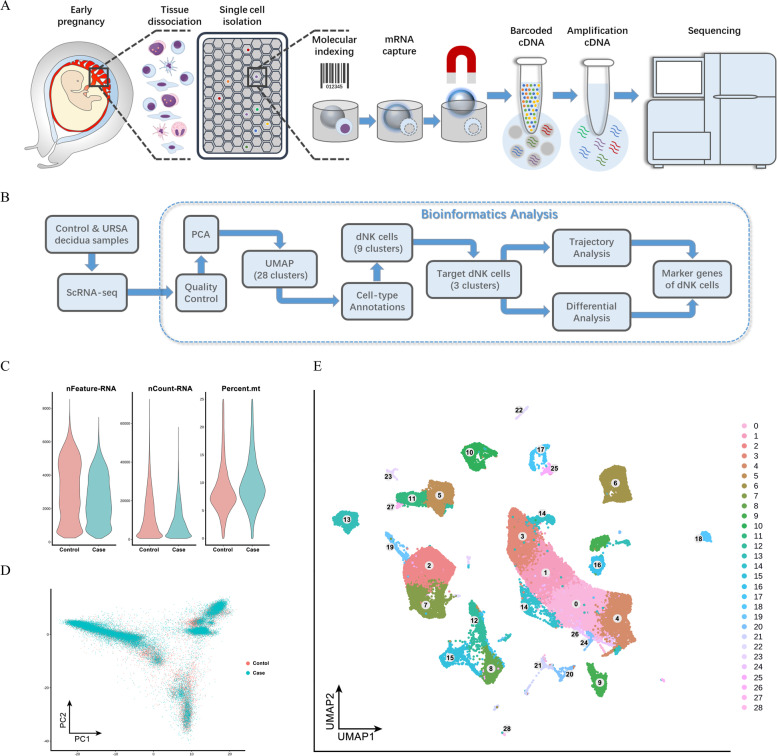
Fig. 1.
Identification the cell atlas at the decidua in scRNA-seq. A The maternal–fetal interface tissues were made into single-cell suspensions and then sorted and analysed using the BD Rhapsody™ system. B The changes in dNK cells in URSA patients were studied by transcriptome analysis. C A total of 63,249 high-quality cell samples were obtained for further analysis. D The analysis scope was preliminarily determined by principal component analysis (PCA) with related gene screening. E Twenty-nine clusters (0 to 28) of cells were identified by bioinformatics analysis of gene expression characteristics of all single-cell samples by UMAP visual analysis

