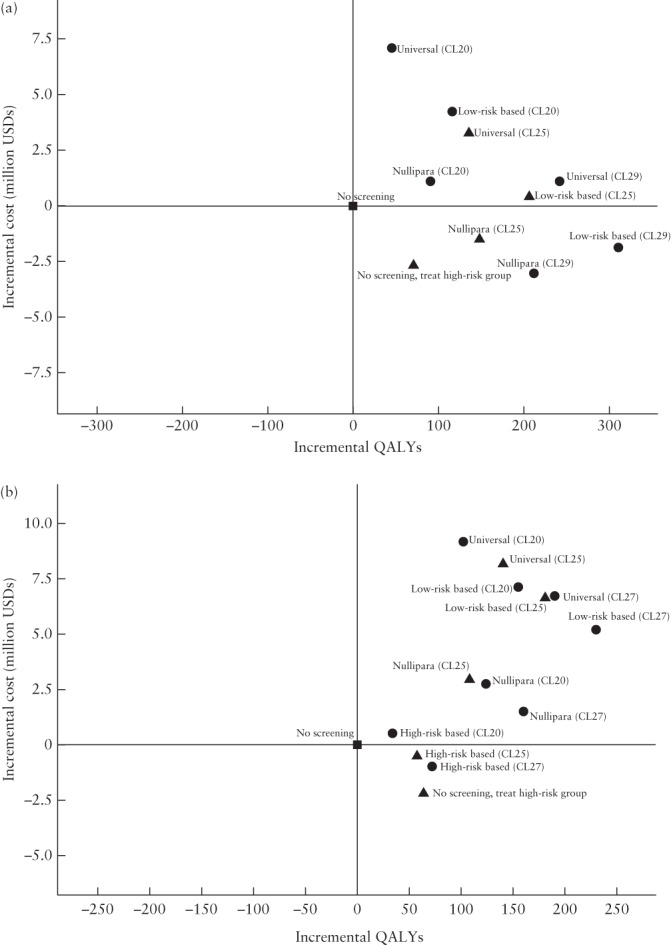
Figure 2.

Cost‐effectiveness plane showing the incremental cost‐effectiveness ratio (ICER) per 100 000 women in the lifetime horizon for all screening strategies with cervical length (CL) measurement at 18 + 0 to 20 + 6 weeks (Cx1) (a) and at 21 + 0 to 23 + 6 weeks (Cx2) (b). ‘No screening’ strategy is used as reference. (a) At Cx1, ‘Nullipara screening’ CL29 dominates all other strategies. The ICER for ‘Low‐risk‐based screening’ CL29 vs ‘Nullipara screening’ CL29 is 11 800 US dollars (USD) per gained quality‐adjusted life year (QALY). (b) At Cx2, not dominated strategies are ‘No screening, treat high‐risk group’, ‘Nullipara screening’ CL27 and ‘Low‐risk‐based screening’ CL27. The ICER for ‘Nullipara screening’ CL27 vs ‘No screening, treat high‐risk group’ is 37 500 USD per gained QALY. The ICER for ‘Low‐risk‐based screening’ CL27 compared with ‘Nullipara screening’ CL27 is 53 300 USD per gained QALY.  , ‘No screening’ strategy;
  , base‐case results (CL25);
  , all other results (CL20, CL27, CL29). CL20, high risk of spontaneous preterm delivery (sPTD) indicated by CL ≤ 20 mm; CL25, high risk of sPTD indicated by CL ≤ 25 mm; CL27, high risk of sPTD indicated by CL ≤ 27 mm; CL29, high risk of sPTD indicated by CL ≤ 29 mm.
