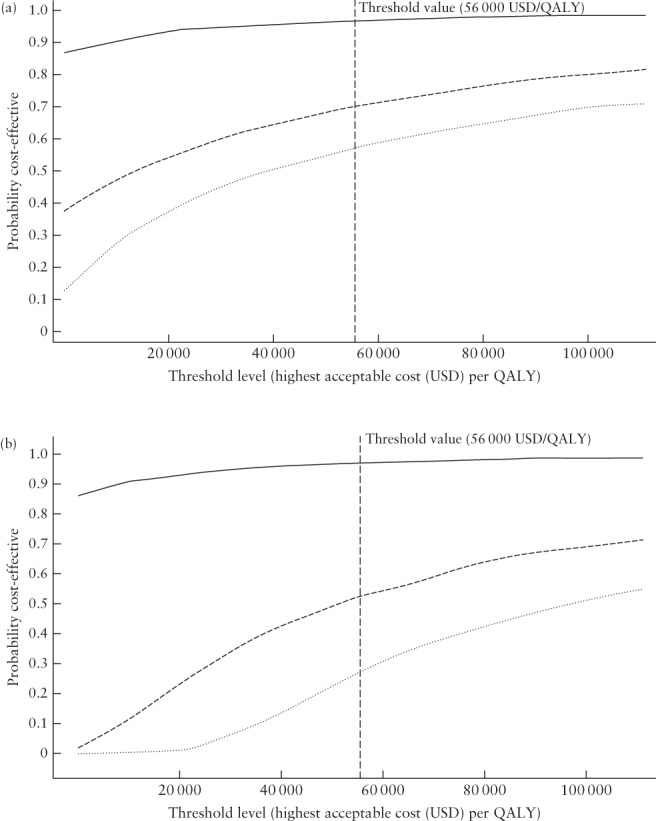
Figure 3.

Cost‐effectiveness acceptability curves for cervical length (CL) screening at 18 + 0 to 20 + 6 weeks (Cx1) (a) and at 21 + 0 to 23 + 6 weeks (Cx2) (b) when CL ≤ 25 mm is used to indicate high risk of spontaneous preterm delivery (base‐case), showing the likelihood of the strategies ‘No screening, treat high‐risk group’ and ‘Low‐risk‐based screening’ CL25 being cost‐effective compared with each other, as well as in comparison with ‘No screening’. Willingness to pay (in US dollars (USD)) is shown on the x‐axis, and the likelihood of the strategy being cost‐effective is shown on the y‐axis. (a) At Cx1, ‘No screening, treat high‐risk group’ is likely to be cost‐effective at a low threshold level for willingness to pay per gained quality‐adjusted life year (QALY) compared with ‘No screening’ (approximately 95%) ( ). The probability of ‘Low‐risk‐based screening’ CL25 being cost‐effective if the willingness to pay is at most 500 000 Swedish krona (SEK) (56 000 USD) per gained QALY
53
is 71% compared with ‘No screening’ (
 ) and 58% compared with ‘No screening, treat high‐risk group’ (
 ). (b) At Cx2, the strategy ‘No screening, treat high‐risk group’ is likely to be cost‐effective at a low threshold level for willingness to pay per gained QALY compared with ‘No screening’ (approximately 90%) (
 ). The probability of ‘Low‐risk‐based screening’ CL25 being cost‐effective if the willingness to pay is at most 500 000 SEK (56 000 USD) per gained QALY
53
is 53% compared with ‘No screening’ (
 ) and 28% compared with ‘No screening, treat high‐risk group’ (
 ).
).
