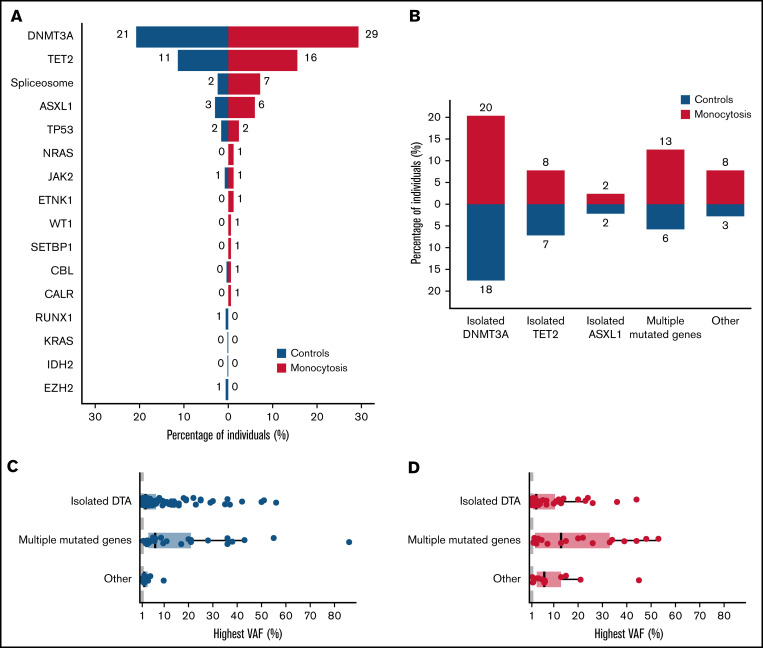
Figure 4.
Mutational spectra for individuals with monocytosis and 1:3 matched control subjects (II). (A) Pyramid plot indicating the proportion of individuals with detected gene mutations within the monocytosis (red) and control (blue) cohort. The category of spliceosome mutations includes SF3B1, SRSF2, and U2AF1. The proportion of individuals carrying the gene mutation is given. (B) Bar plot showing the proportion of monocytosis cases (red, top) and controls (blue, bottom) with mutational spectra confined to mutated DNMT3A, TET2, or ASXL1, or multiple mutated genes. The category “other” denotes isolated gene mutations other than DNMT3A, TET2, or ASXL1. The proportion of individuals for each category is given. Highest detected VAF according to mutational spectrum for monocytosis cases (red, C) and controls (blue, D). Individuals were classified as carrying CH confined to mutated DNMT3A, TET2, or ASXL1 (isolated DTA), CH involving multiple mutated genes, and other isolated gene mutations (other). Boxes represent the median and first and third quartiles. DTA, DNMT3A, TET2, or ASXL1.

