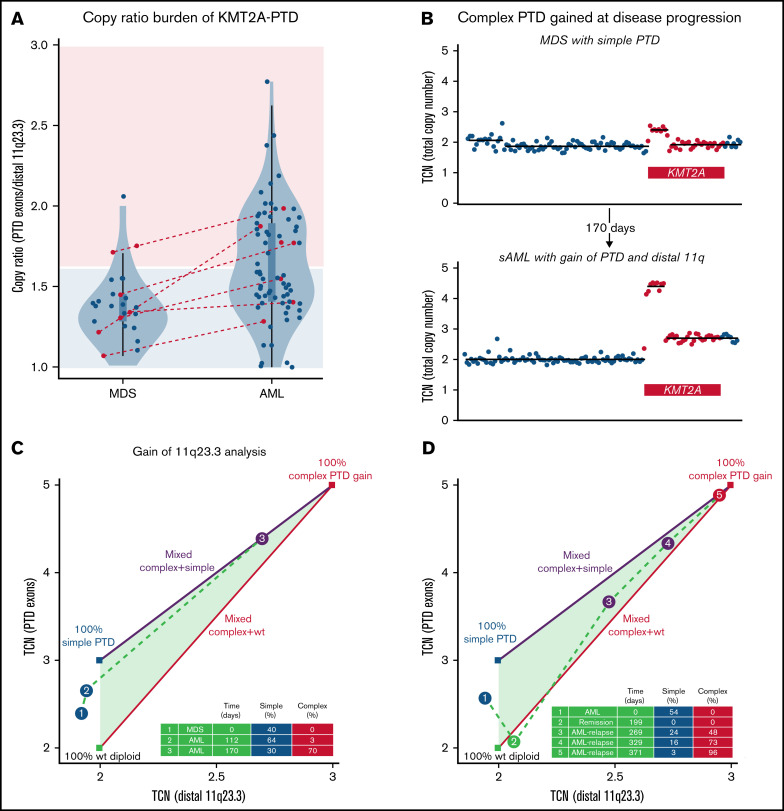
Figure 2.
Emergence of KMT2A-PTD complexity during progression to AML and relapse. (A) Copy number ratios of KMT2A-PTDs at first available time points by diagnosis were unimodal in MDS (P = .843; dip test) and multimodal in AML (P = .027) with 2 main clusters presumed to correspond roughly to simple and complex KMT2A-PTDs. High ratios were accordingly enriched in AML (33/73; 45%) over MDS (3/25; 12%) (P = .003; Fisher’s exact test) relative to a cutoff (1.6) separating pure simple KMT2A-PTD cells (area shaded light blue) from complex (area shaded pink). Red: cases with secondary AML transformation from MDS (N = 7) or PV (N = 1). Box plots within violin plots: rectangles correspond to interquartile ranges, and whiskers have length equal to 1.5 times interquartile range or end at most extreme outliers. (B) 11q23.3 gain from the PTD allele emerged in a rapidly progressing AML that transformed from MDS with simple KMT2A-PTD (P3). Panels C and D show quantitative evolution of KMT2A-PTD complexity in 2 cases of AML (P3 and P4). Complex, simple, and wild-type components are determined from total copy number (TCN) of PTD exons (y-axis) vs TCN of distal 11q23 (x-axis): vertices of the triangle represent 100% populations of wild-type diploid KMT2A (green vertex), simple PTD (blue vertex), and complex PTD with single PTD gain (red vertex); because TCN is linear, line segments connecting 2 vertices represent mixtures of the 2 corresponding components, whereas the triangle (convex hull of the vertices) represents mixtures of all 3 (wild-type, simple PTD, and complex PTD). (C) 11q23.3 gain from the PTD allele emerged at d112 (blue point 2) and expanded as the dominant clone at d170 (purple point 3 corresponding to copy number profile in panel B). The complex gain at d112 was below the BR-CNV limit of detection, but its low-level presence (>3%) was inferred from clonal hierarchy, based on an NRAS variant that appeared at d112 but was subsequently deduced as subclonal to the complex PTD at d170 (supplemental Figure 13A). TCN levels at d170 (distal 11q23 = 2.7, PTD exons = 4.4) implied a mixed population comprising c = 70% complex KMT2A-PTD, s = 30% simple KMT2A-PTD, and w = 0% wild-type, by solving the linear constraints (1) TCN of distal 11q23 = 2.7 = 3c + 2s + 2w, (2) TCN of PTD exons = 4.4 = 5c + 3s + 2w, and (3) 1 = c + s + w. (D) 11q23.3 gain from the PTD allele emerged at posttransplant relapse from a previously simple KMT2A-PTD before transplant. The simple KMT2A-PTD component diminished (24% to 16% to 3%) as the complex component expanded (48% to 73% to 96%) over the course of 102 days. WT, wild-type.

