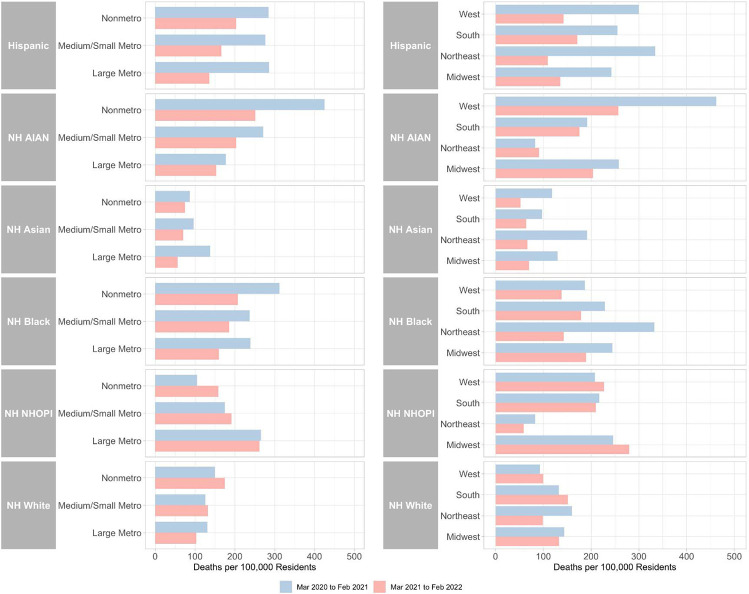
Figure 1. Age-Standardized Covid-19 Death Rates by Race/Ethnicity across Metro-Nonmetro Categories and Census Regions, March 2020-February 2021 and March 2021-February 2022.
NH = Non-Hispanic ∣ AIAN = American Indian or Alaska Native ∣ NHOPI = Native Hawaiian or Other Pacific Islander
Notes: Death rates were age-standardized using 3 age groups (0-54, 55-74 and 75+) and the overall U.S. 2020 population as the standard population. Data was imputed for one or more age categories for NH NHOPI in year 1 and year 2 in the Northeast because death counts were between 1 and 9 for one or more age categories and were thus suppressed by CDC WONDER.

